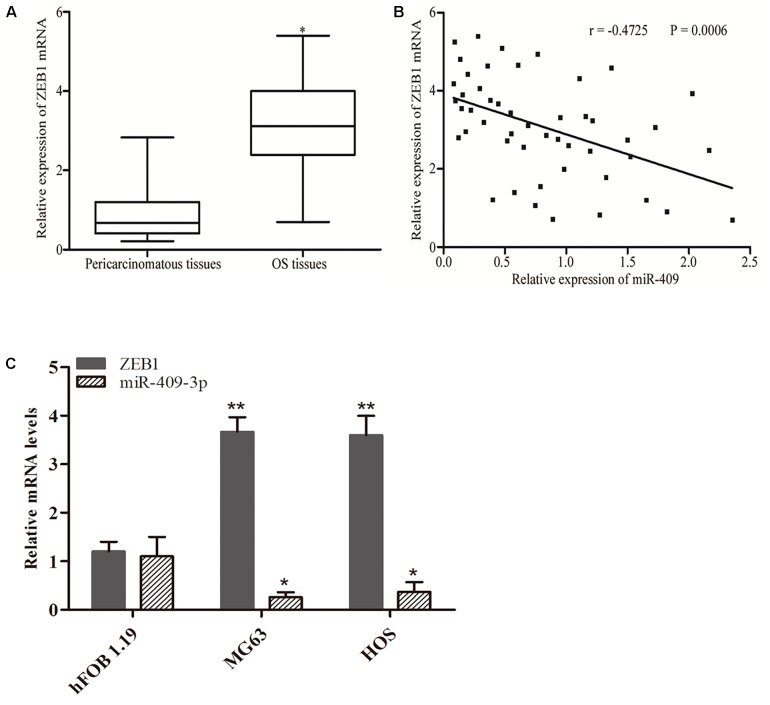
FIGURE 4.
Inverse correlation between miR-409-3p and ZEB1 mRNA expression levels in OS tissues. (A) RT-qPCR analysis showing that ZEB1 mRNA levels were increased in OS tissues. (B) Spearman’s correlation analysis of the association between miR-409-3p and ZEB1 mRNA in OS tissues. (C) Expressions of miR-409-3p and ZEB1 mRNA in cell lines. miR-409, microRNA-409-3p. OS, osteosarcoma. ZEB1, Zinc-finger E-box-binding Homeobox-1. mRNA, message RNA. ∗P < 0.05, ∗∗P < 0.01 compared with the control group.

