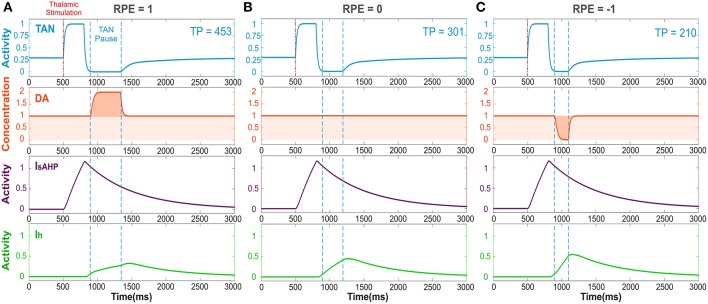
Figure 2.
The TAN pause duration positively correlates with the reward prediction error (RPE). Thalamic stimulus induces an initial burst of TAN activity, followed by a TAN pause. The blue curve is TAN activity; the orange curve is dopamine (DA) concentration; the purple curve is the slow after-hyperpolarization current IsAHP and the green curve is the h-current Ih. (A) RPE = 1, the dopamine concentration increases during the TAN pause as a result of the positive RPE, which slows down Ih activation and thus prolong the pause. (B) For RPE = 0, the TAN pause is shorter, because there is no phasic change in dopamine release, so the concentration of dopamine remains at baseline during the TAN pause. (C) RPE = −1, the TAN pause is even shorter than for RPE = 0 because there is a net decrease in dopamine concentration during the pause, which provides the fastest Ih activation and hence, the shortest pause in TAN activity. Thalamic stimulation duration was 300 ms. TP stands for TAN pause duration in milliseconds.

