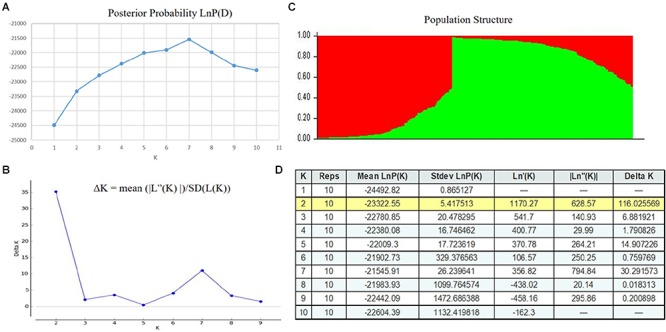
FIGURE 1.

Population Structure of 292 diverse genotypes, the graphical presentation of estimation of posterior probability (A) and ΔK (B), as well as tabulated values (D) and, Q-values based population structure (C) of 292 diverse potato genotypes with 1–10 K populations. The colored region grouped the genotypes in corresponding populations as Red (P1) and Green (P2).
