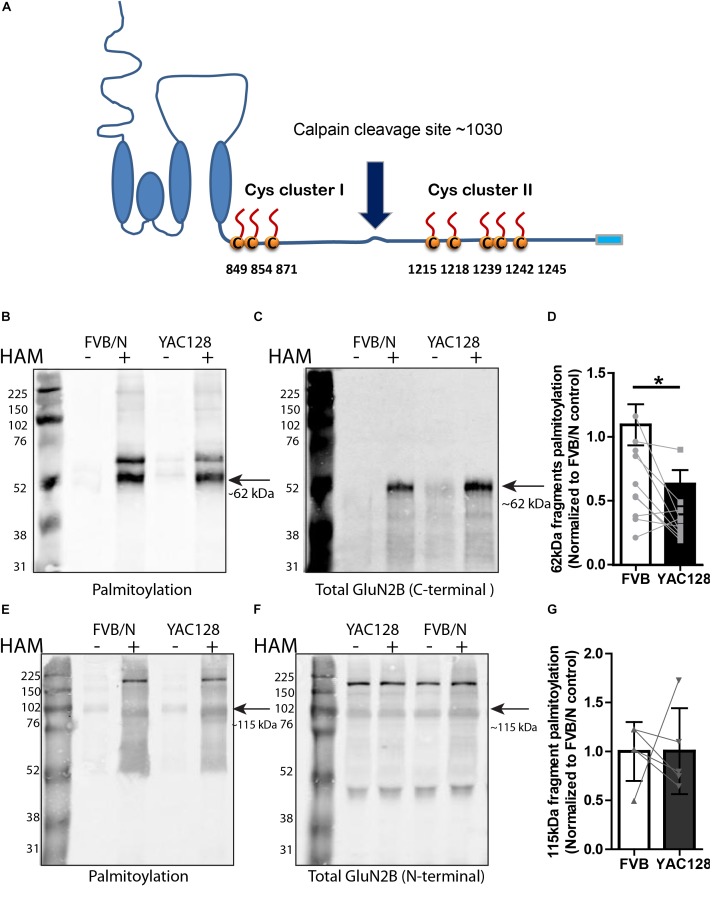
FIGURE 2.
Calpain cleavage of GluN2B to isolate Cys cluster II-containing C-terminal fragment reveals reduced palmitoylation in YAC128 striatum. (A) Cartoon indicating relative location of GluN2B Cys clusters I and II and the major calpain cleavage site. Each panel of image data shows results from one representative gel and the dividing line(s) indicate where lanes were removed for ease of comparing genotypes under identical experimental conditions. (B–D) Palmitoylation of Cys cluster II-containing C-terminal fragment was examined by IP/Btn-BMCC method. Representative blots show that palmitoylation (detected by probing with streptavidin Alexa 680, B) of GluN2B Cys cluster II-containing C-terminal fragment as a ratio to total GluN2B levels (detected by C-terminal specific antibody MA1-2014, as shown in C) was significantly decreased in striatum from YAC128 compared to FVB/N wild-type mice. Black arrow = ∼62 kDa cluster II-containing C-terminal fragment. (D) Summary graph indicates the corresponding ratio of palmitoylation signal (calculated as in Figure 1) for YAC128 normalized to the FVB/N control. Data presented for striatal tissue from 10 independent experiments; bars represent means ± SD ∗p < 0.05 (paired t-test) and data points from same experiment are connected by lines. (E–G) Palmitoylation of Cys cluster I-containing N-terminal fragment was examined by ABE/western blotting method. (E) Purified palmitoylated GluN2B was detected with GluN2B N-terminal specific antibody (AGC-003); total GluN2B expression is shown in representative blot in (F), using the same ACG-003 antibody. Black arrow = ∼115 kDa cluster I-containing N-terminal fragment. (G) Palmitoylation level of cluster I-containing fragment of GluN2B was calculated as ratio of palmitoylation signal (shown in E) to the total protein signal (in F); summary graph indicates corresponding palmitoylation level in YAC128 normalized to FVB/N, as in Figure 1. Data presented for striatal tissue from 7 independent experiments; bars represent means ± SD and data points from same experiment are connected by a line.

