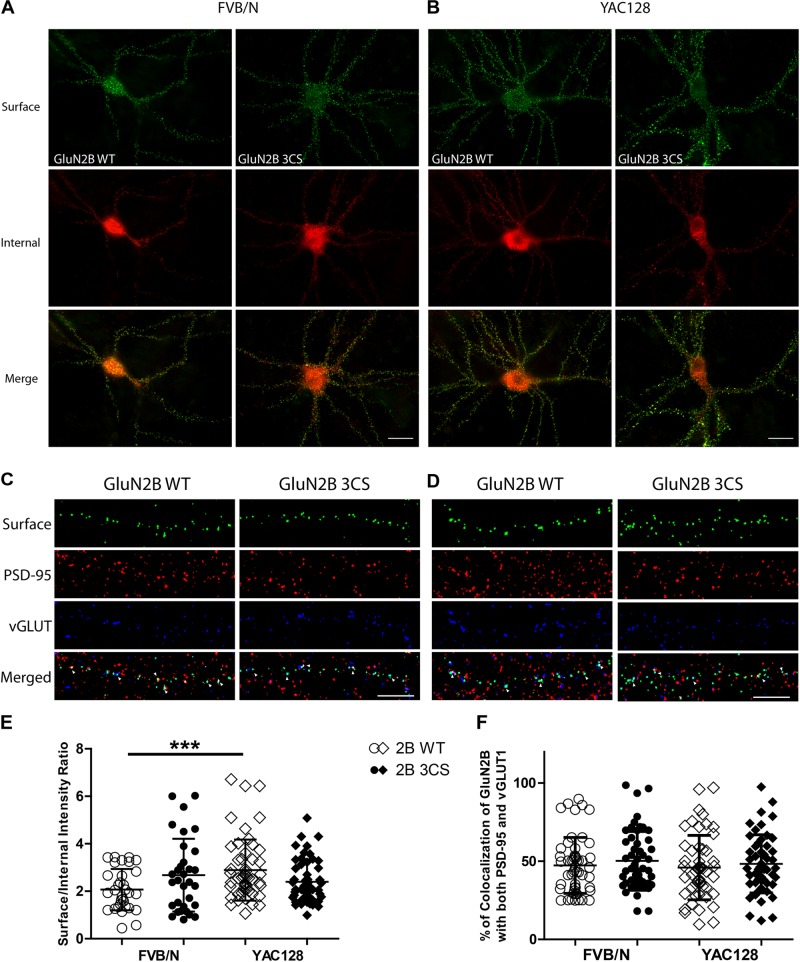
FIGURE 3.
Loss of Cys cluster I (GluN2B 3CS) palmitoylation of GluN2B does not affect the surface expression of 2B-NMDARs in striatal neurons. GFP-tagged GluN2B wild type (WT) and Cys cluster I mutant (GluN2B 3CS) were nucleofected in striatal neurons co-cultured with cortical neurons. (A) Images representing the surface/internal expression of GluN2B in striatal neurons in MSN-CTX co-cultures from FVB/N mice. Neuronal cultures were live stained for surface GluN2B (green) with GFP antibody at DIV 18, then fixed and stained for internal GluN2B (red). Merged image shows the total GluN2B expression. Scale bars, 20 μm. (B) Representative images of surface (green)/internal (red) expression of GluN2B in striatal neurons co-cultured with cortical neurons from YAC128 mice. (C,D) Images representing the colocalization of surface GluN2B (green) with excitatory synaptic markers, PSD-95 (red) and vGLUT1 (blue), in striatal neurons in MSN-CTX co-cultures expressing the wild type and Cys cluster I mutant (GluN2B 3CS). Scale bars, 10 μm. (E) Quantitative analysis for the ratio of surface/internal GluN2B intensity. Data from FVB/N and YAC128 co-cultures were acquired in paired experiments (N = 4 paired culture batches, 52 cells for each genotype and construct). GluN2B WT surface intensity was significantly enhanced in YAC128 vs. FVB/N striatal neurons (two-way ANOVA, p = 0.0310 for mouse genotype, p = 0.7749 for GluN2B construct, and p = 0.0036 for interaction; ∗∗∗p < 0.001 by Bonferroni’s post hoc test). (F) Summary graph of the colocalization of surface puncta of GluN2B with PSD-95 and vGLUT1. Data show no significant difference between genotype or GluN2B construct (two-way ANOVA, p = 0.4987 for genotype, p = 0.1318 for 3CS mutant, p = 0.8475 for interaction; n.sp > 0.05 by Bonferroni’s post hoc tests). Colocalization data were from 3 independent experiments/38 cells analyzed in FVB/N and 3 independent experiments/44 cells analyzed in YAC128.

