FIGURE 4.
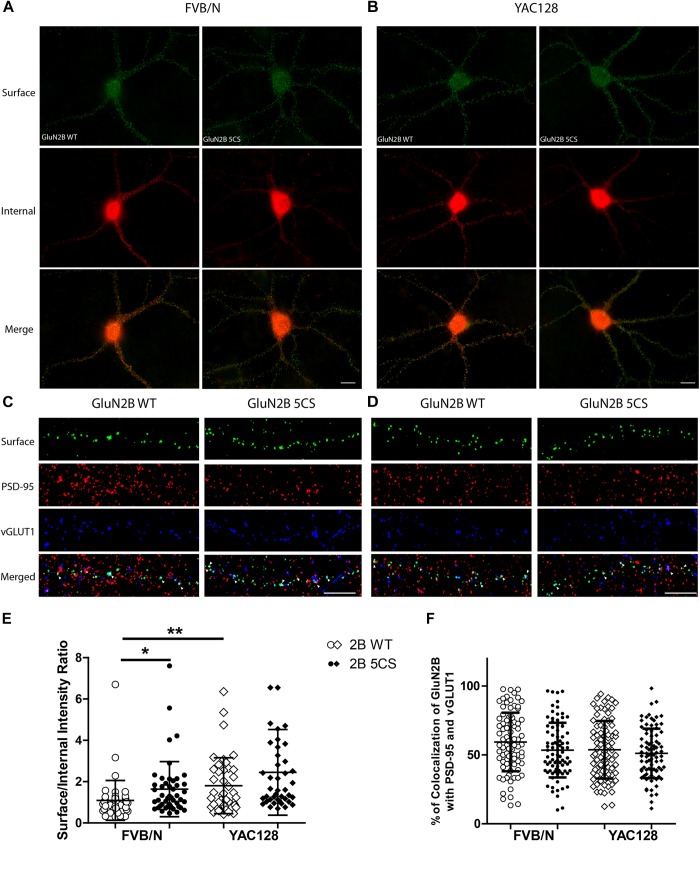
Loss of Cys cluster II (GluN2B 5CS) palmitoylation of GluN2B regulates the surface expression of GluN2B in striatal neurons. GFP-tagged GluN2B wild type (WT) and Cys cluster II mutant (GluN2B 5CS) were nucleofected in striatal neurons co-cultured with cortical neurons. (A) Images representing the surface (green)/internal (red) expression of GluN2B in striatal neurons in MSN-CTX co-cultures from FVB/N mice. Merged image shows the total GluN2B expression. Scale bars, 20 μm. (B) Representative images of surface (green)/internal (red) expression of GluN2B in striatal neurons co-cultured with cortical neurons from YAC128 mice. (C,D) Representative images of surface GluN2B puncta colocalization with the excitatory synaptic markers PSD-95 and vGLUT1 for GluN2B WT and 5CS in FVB/N and YAC128 DIV 18 striatal neurons in MSN-CTX co-cultures. Scale bars, 10 μm. (E) Quantitative analysis for the ratio of surface to internal GluN2B intensity was performed for data from paired experiments from 4 batches each of FVB/N and YAC128 MSN-CTX co-cultures. Similar to results shown in Figure 3E, GluN2B WT surface intensity was significantly enhanced in YAC128 vs. FVB/N striatal neurons; as well, surface intensity was significantly enhanced in FVB/N but not YAC128 striatal neurons expressing the GluN2B 5CS [FVB/N: N = 4(48 cells), YAC128: N = 4(42 cells)] when compared to neurons expressing GluN2B WT [FVB/N: N = 4(48 cells), YAC128: N = 4(42 cells)]. Significant by two-way ANOVA, p = 0.0012 for genotype, p = 0.0129 for 2B construct, and p = 0.9970 for interaction; ∗∗p < 0.01, ∗p < 0.05 by Bonferroni’s post hoc test. (F) Summary graph shows similar colocalization of GluN2B WT and 5CS punctae with both PSD-95 and vGLUT1. Colocalization data were from 4 independent experiments/38 cells analyzed in FVB/N and 4 independent experiments/36 cells analyzed in YAC128. Two-way ANOVA, p = 0.1785 for genotype, p = 0.0592 for 5CS mutant, p = 0.1571 for interaction; p > 0.05 by Bonferroni’s post hoc test.

