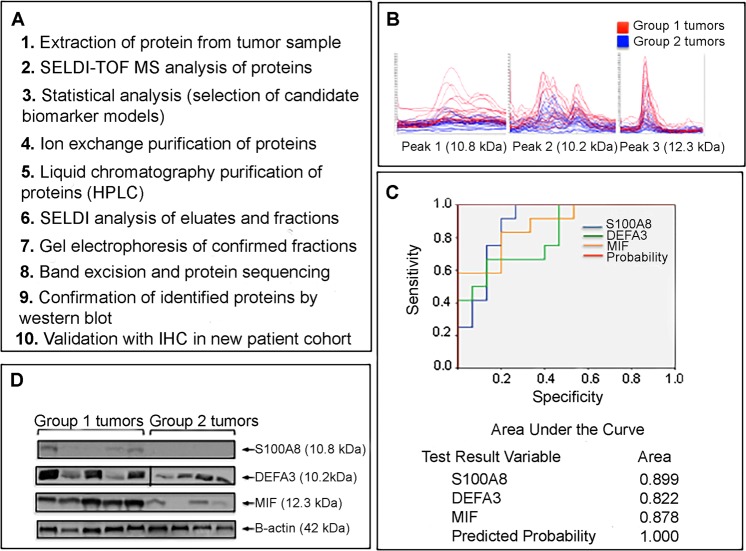
Figure 1.
Identification of Macrophage Migration Inhibitory Factor (MIF) in GBM patient samples. (A) Flow chart of the steps taken to identify MIF using protein lysates extracted from GBM MGMT methylated patient specimens (n = 36). (B) SELDI-TOF MS spectra demonstrating 3 differentially expressed protein peaks in Group 1 tumors (survival <13.8 months; n = 18) and Group 2 tumors (survival >13.8 months; n = 18). Peaks in red belong to proteins overexpressed in Group 1 tumors. (C) Receiver Operating Characteristic (ROC) analysis for the 3 proteins (S100A8 [blue], DEFA3 [green] and MIF [yellow]) to discriminate Group 1 tumors from Group 2 tumors. The Area Under the Curve (AUC) values are provided. (D) Representative western blots depicting changes in protein expression in lysates from Group 1 (n = 5) and Group 2 (n = 4) tumors. Untreated lysates were extracted from frozen GBM specimens and probed with the indicated antibodies.

