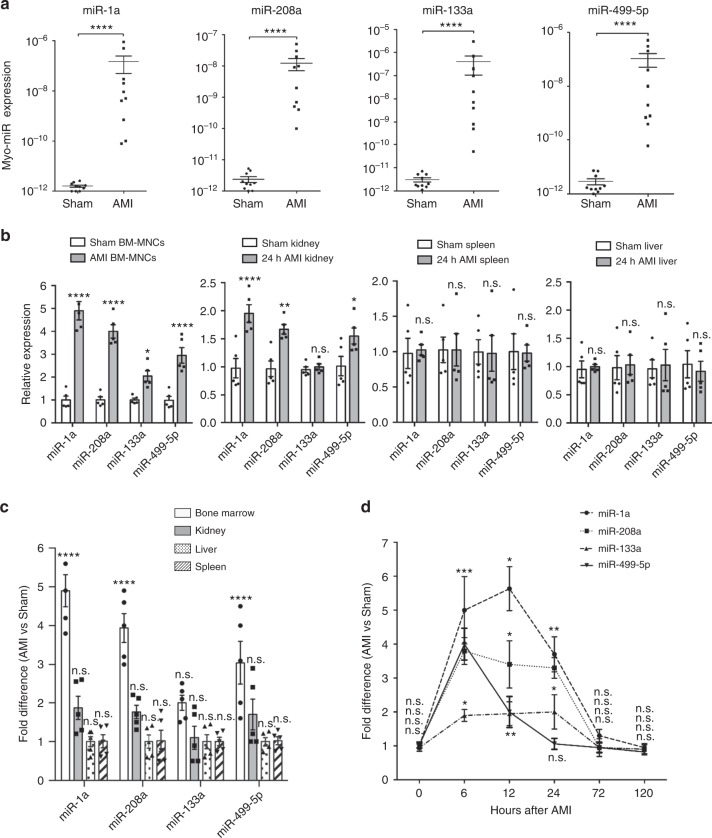
Fig. 1.
Myo-miRs are released into PB following AMI and transported into BM-MNCs. AMI and Sham surgeries were performed in C57BL/6 mice; then at various time points, the plasma, BM-MNCs, and different organs were isolated and subjected to qRT-PCR analyzes of myo-miRs, miR-1a, 208a, 133a, and 499-5p. a myo-miR levels in the plasma 6 h post-surgery (n = 10 animals per group). b myo-miR levels in the BM-MNCs, kidney, spleen, and liver 12 h post-surgeries, expressed relative to the levels in the intact controls (n = 5 animals per group), and c the fold difference in AMI vs. Sham mice (n = 5 animals per group). *p < 0.05, **p < 0.01, ***p < 0.001, ****p < 0.0001 vs. Sham; n.s., no significant. d The fold difference of myo-miR levels in the BM-MNCs of AMI vs. Sham mice at 0, 6, 12, 24, 72, and 120 h post-surgery. *p < 0.05 **p < 0.01, ***p < 0.001 vs. Sham at same time point. n = 5 animals per group per time point. An unpaired t test was used in a and a two-way ANOVA was used in b, c, and d for statistical analysis. Error bars represent mean ± s.e.m

