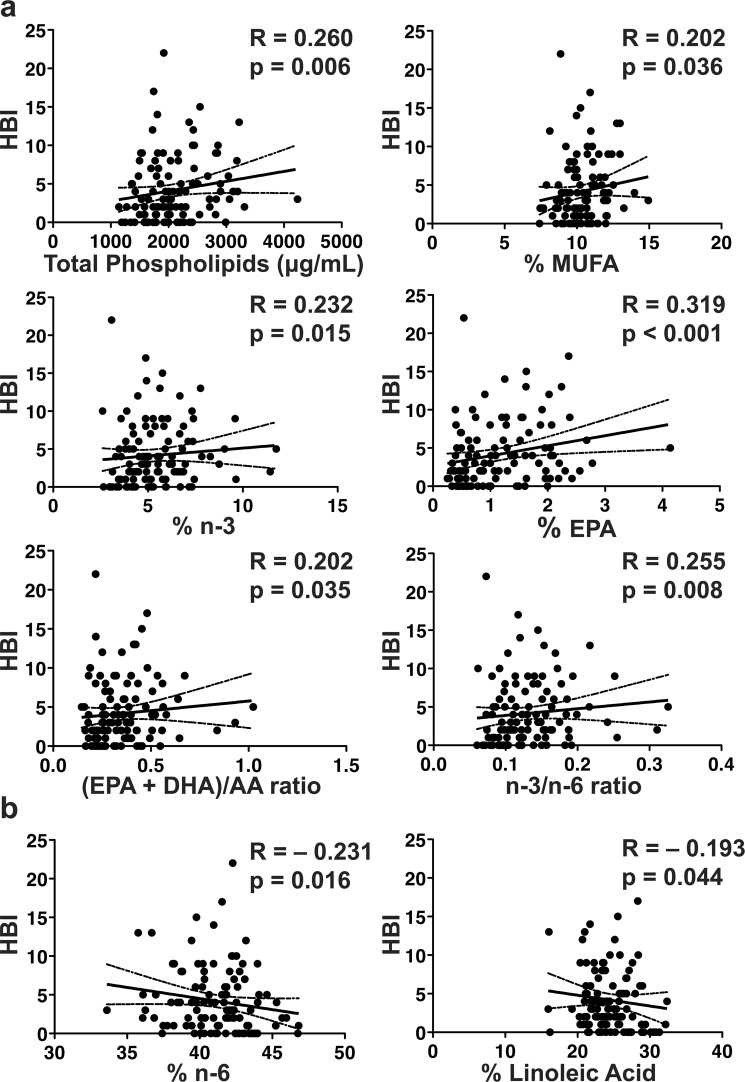
Figure 1.
Clinical disease activity correlates with serum fatty acids. Clinical disease activity correlates directly with (a) total phospholipids, % MUFA, % n-3, % EPA, (EPA + DHA)/AA ratio, and n-3/n-6 ratio, but inversely correlates with (b) % n-6 and linoleic acid. Clinical disease activity by HBI shown as a continuous variable on the Y-axis. The spearman rho (R) is shown with corresponding p-value. The solid line represents the line of best fit with 95% confidence intervals (dashed lines). n = 111 for CD patients.

