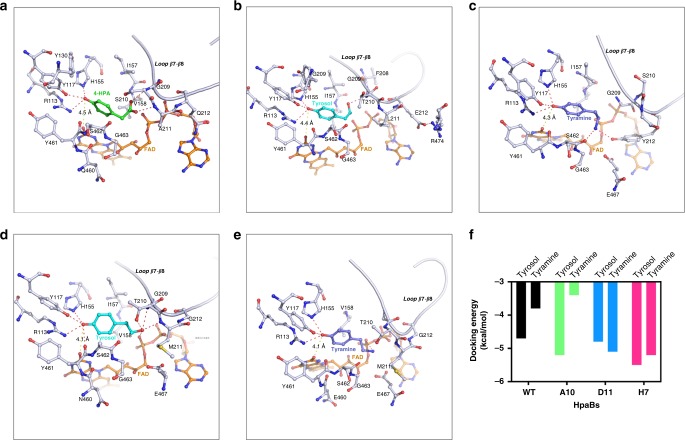
Fig. 4.
Molecular modeling of HpaB-substrate complexes. a Docking of 4-HPA to wild type HpaB, 4-HPA was shown as green stick; b Docking of tyrosol to mutant A10, tyrosol was shown as light blue stick; c Docking of tyramine to mutant D11, tyramine was shown as dark blue stick; d docking of tyrosol to mutant H7, tyrosol was shown as light blue stick; e Docking of tyramine to mutant H7, tyramine was shown as dark blue stick; FAD was colored as brown, hydrogen bonds were colored as magenta dash lines, and the distance from substrate to FAD were presented as yellow dash lines. f Docking energy of tyrosol and tyramine for HpaB wild type, A10, D11, and H7. The PDB files for generating a–e are provided as five independent Source Data files. In addition, source data to generate Fig. 4f are provided in the Excel format Source Data file

