Figure 1.
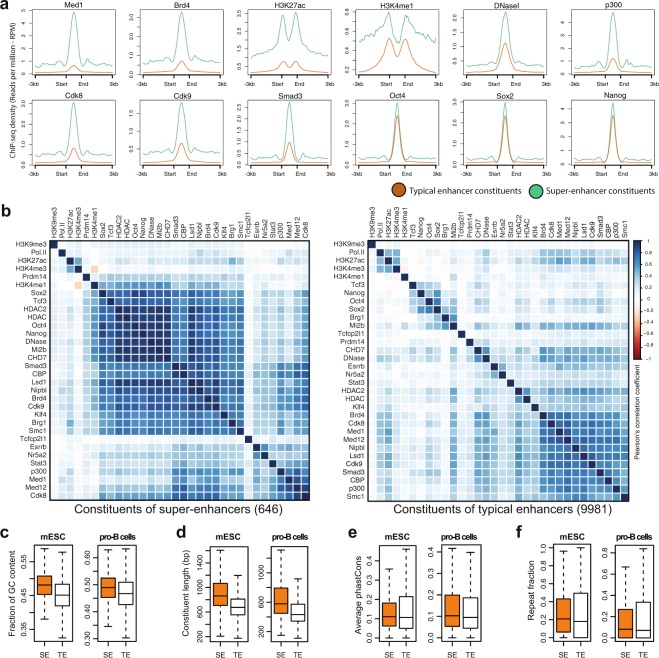
Chromatin regulators, TFs and sequence signatures of the constituents of SEs and TEs. (a) Average ChIP-seq profile (RPM) of Med1, Brd4, H3K27ac, H3K4me1, DNaseI, p300, Cdk8, Cdk9, Smad3, Oct4, Sox2 and Nanog at the constituents of SEs and TEs, and their flanking 3 kb regions (b) Correlation plot using Pearsons’ correlation coefficient with hierarchical clustering of normalized ChIP-seq signals (rpm/bp) of 32 factors at the constituents of SEs (646) and TEs (9981). More factors were correlated at SEs as compared to TEs, but the factors with similar lineage/functionality were clustered together, for example, active histone modifications (H3K27ac and H3K4me3), the Mediator subunits (Med1, Med12, and Cdk8), and the pluripotency factors of ESC (Oct4, Sox2, Nanog). (c) Box plot shows the fraction of GC content, across the constituents of SEs and TEs in mESC and pro-B cells (p-value < 2.2e-16, Wilcoxon rank sum test). (d) Constituent enhancers size (bp) in mESC and pro-B cells (p-value < 2.2e-16, Wilcoxon rank sum test). (e) Conservation score (phastCons) in mESC (p-value = 0.6285, Wilcoxon rank sum test) and in pro-B cells (p-value < 1.7e-4, Wilcoxon rank sum test). (f) Repeat fraction in mESC (p-value = 0.0202, Wilcoxon rank sum test), pro-B cells (p-value = 0.8976, Wilcoxon rank sum test).

