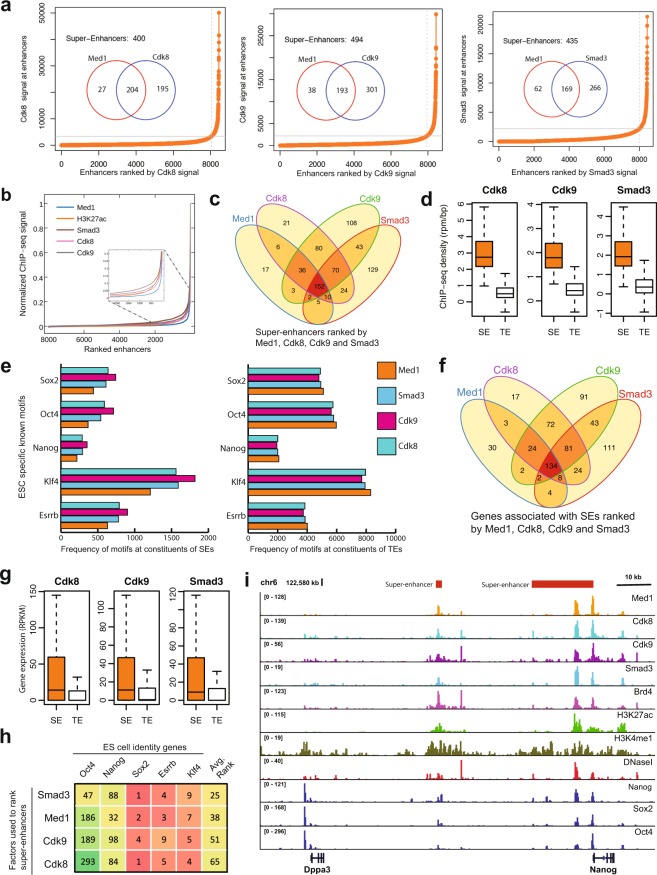
Figure 6.
SEs identified by using Cdk8, Cdk9 and Smad3. (a) The Hockey-stick plot shows the cut-off used to separate SEs from co-OSN (Oct4, Sox2, and Nanog) regions by using Cdk8, Cdk9 and Smad3. (b) The distribution of normalized ChIP-seq signal of Med1, H3K27ac, Cdk8, Cdk9 and Smad3 at mESC enhancers. For each factor, the values were normalized by dividing the ChIP-seq signal at each enhancer by the maximum signal. The rank of enhancer at each factor was measured independently. The figure zoomed at the cut-off so it can be visualized. (c) Venn diagram shows the number of SEs overlapped, ranked using Med1, Cdk8, Cdk9 and Smad3. (d) Boxplot shows the ChIP-seq density (rpm/bp) in SEs and TEs defined by Cdk8, Cdk9 and Smad3 (p-value < 2.2e-16, Wilcoxon rank sum test). (e) Bar-plot shows the frequency of motifs (Oct4, Sox2, Nanog, Klf4 and Essrb) found at the constituents of SEs and TEs defined by Med1, Cdk8, Cdk9 and Smad3. (f) Venn diagram of genes associated with SEs identified using Med1, Cdk8, Cdk9 and Smad3. The genes associated to Med1 SEs are downloaded from dbSUPER. (g) Boxplot shows the gene expression (RPKM) in SEs and TEs defined by Cdk8, Cdk9 and Smad3. (h) Rank of factors based on the rank of SEs associated with of ESC identity genes, including Sox2, Oct4, Nanog, Esrrb and Klf4. The table is sorted based on the average rank. (i) ChIP-seq binding profiles of different factors at the TEs and SEs at Dppa3 and Nanog gene locus in mESC.

