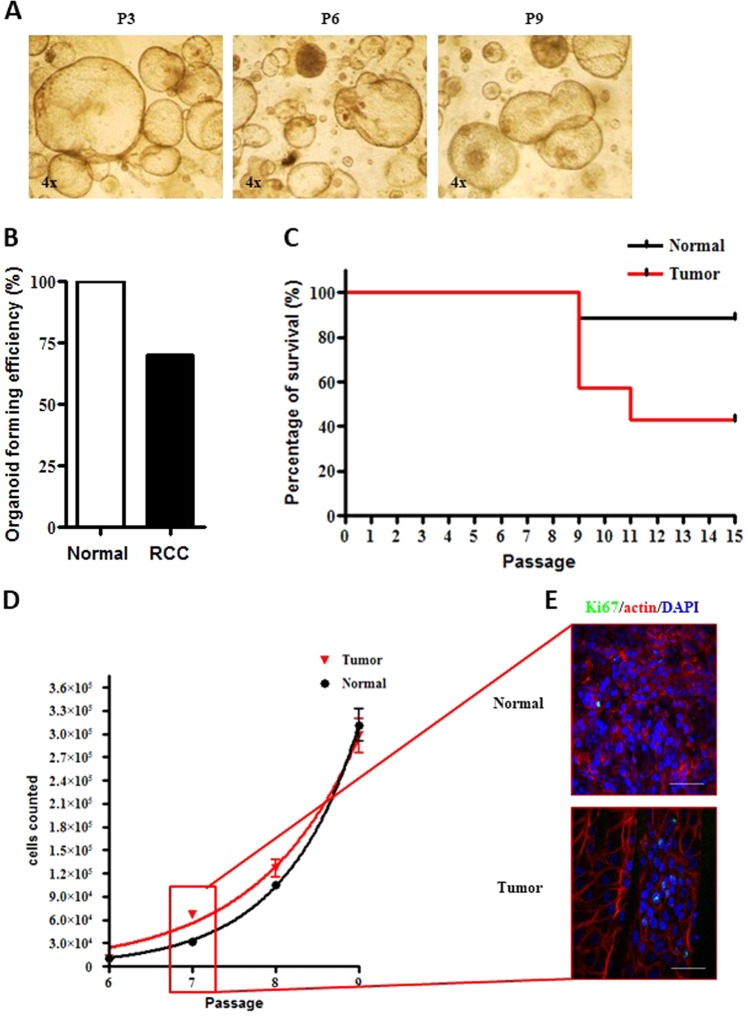
Fig. 4. Establishment of RCC organoid cultures.
a Representative images of RCC kidney organoid cultures at passage (P) 3, 6 and 9. Microscope magnification ×4. b Percentage of organoid culture formation efficiency starting from normal and RCC fresh tissues. c Kaplan-Meier plot of culture persistence over passages of normal (black) and RCC (red) organoids. d Illustration of the number of cells counted in normal (black) and RCC (red) organoids from passages 6 to 9. Results are expressed as mean ± SD of three independent cultures. e Representative confocal microscope images of normal (upper panel) and tumor (lower panel) organoids stained for Ki67 (green) and actin (red). Nuclei are stained with DAPI (blue). Microscope magnification ×60. Scale bars 50 μm. Immunofluorescence images are representative of at least six independent experiments

