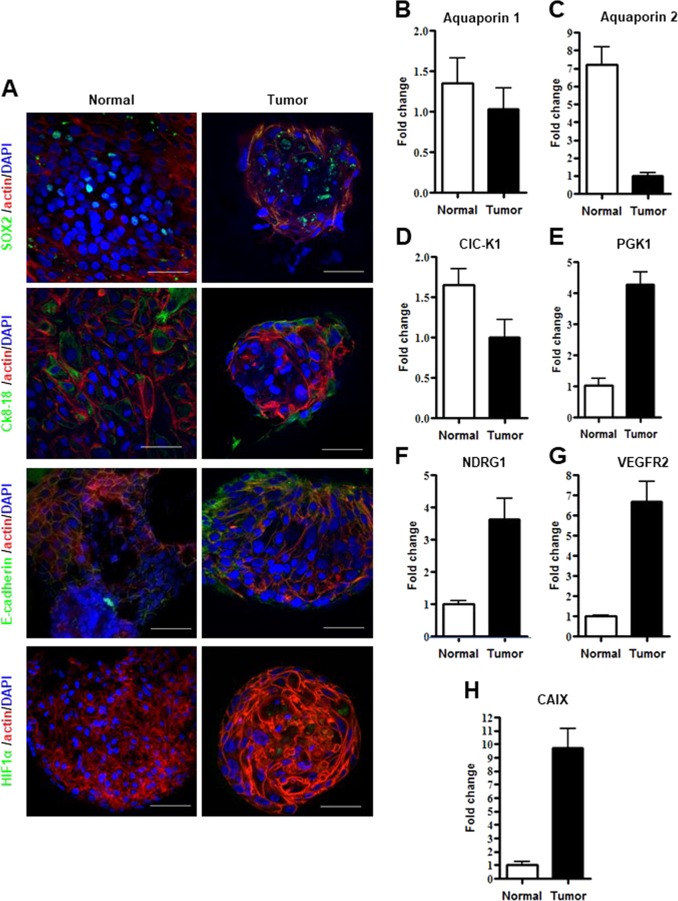
Fig. 5. Characterization of RCC organoid cultures.
a Representative confocal microscope images of normal (left panel) and tumor organoid (right panel) stained for SOX2, Ck8-18, E-cadherin and HIF1α (green), respectively. Nuclei are stained with DAPI (blue) and Actin staining is pseudo-colored in red. Microscope magnification ×60. Scale bars 50 μm. b–h mRNA expression, assessed by qPCR, of Aquaporine 1, Aquaporine 2, ClC-K1, PGK1, NDRG1, VEGFR2, CAIX in normal kidney and RCC organoid cultures. Results are shown as a mean ± SD of at least three independent experiments. Immunofluorescence images are representative of at least six independent experiments

