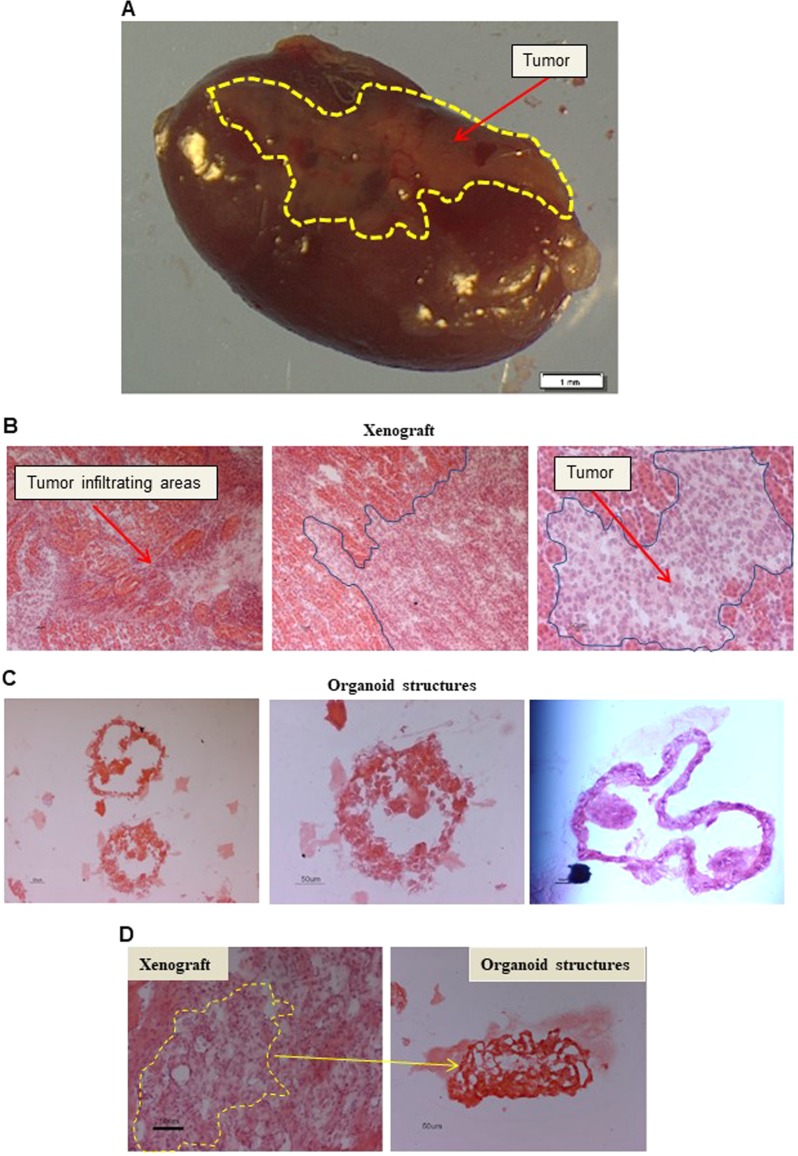
Fig. 6. Organoids in vivo propagation.
a Representative stereomicroscopic image of the tumor mass (Tumor, red arrow) excised 120 days after injection of a RCC organoid culture, under the renal capsule of immunocompromised mice. The cancer mass is highlighted by a yellow line. Scale bars 1 mm. b Representative H&E images of a xenograft derived from a G4 ccRCC organoid culture. Blue lines and red arrows indicate human tumor invading the mouse parenchyma. Microscope magnification ×10 (left and central panels) and 20 (right panel) (c) H&E staining of the original matrigel organoid culture included in OCT and cut in 5 μm slides for staining. Microscope magnification x20 Scale bars 50 μm. d H&E staining of the original matrigel organoid cultures and xenograft tumor masses included in OCT, cut in 5 μm slides for staining. Microscope magnification x20 Scale bars 50 μm

