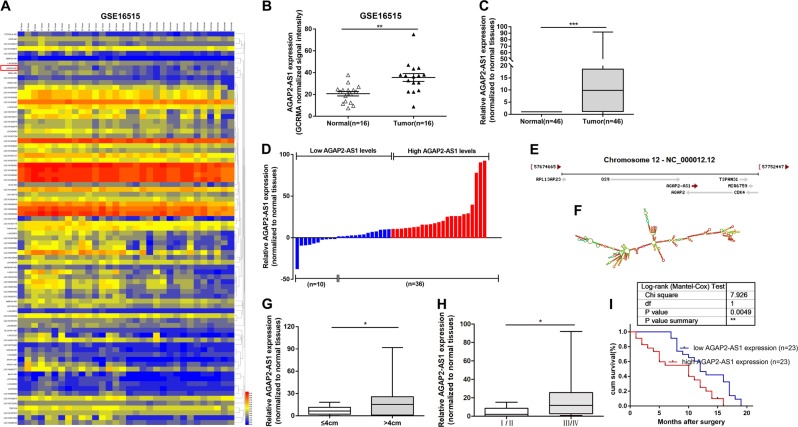
Fig. 1. Expression of AGAP2-AS1 in pancreatic cancer (PC) tissues and its clinical parameters.
a The GSE16515 data set containing lncRNAs profiles of 16 human PC tissues and 16 corresponding para-cancerous tissues was analyzed, and lncRNAs with P < 0.05 and logFC > 0 in the original normalized signal data were screened out. The original normalized signal data was log10 converted. b AGAP2-AS1 expression of GCRMA normalized signal intensity in PC tissues (n = 16) compared with noncancerous tissues (n = 16) analyzed using microarray data from Gene Expression Omnibus data sets. c Relative expression levels of AGAP2-AS1 in PC tissues (n = 46) compared with adjacent non-tumor tissues (n = 46). AGAP2-AS1 expression was examined by quantitative real-time PCR (qRT-PCR) and normalized to GAPDH expression. The expression levels of AGAP2-AS1 in tumor tissues relative to normal tissues were calculated as [(AGAP2−AS1CTnormal–GAPDHCTnormal) − (AGAP2−AS1CTtumor–GAPDHCTtumor)]. d Samples were classified into relatively high- and low-expression group according to the median value of the AGAP2-AS1 expression level in PC tissues. e AGAP2-AS1 as published in the NCBI database (NR_027032.1). f Prediction of AGAP2-AS1 structure based on minimum free energy (MFE) and partition function. The color scale indicates the confidence for the prediction for each base, with shades of red indicating strong confidence. g Patients with larger tumors (>4 cm) had higher levels of AGAP2-AS1 expression than patients with smaller tumors (≤4 cm). h Comparison of the expression levels of AGAP2-AS1 in patients with higher pathological stage (III/IV) and those with lower pathological stage (I/II), these were significantly higher in the latter case. i Kaplan–Meier overall survival (OS) curves of patients with pancreatic cancer according to AGAP2-AS1 expression levels. *P < 0.05, **P < 0.01, ***P < 0.001

