Fig. 7.
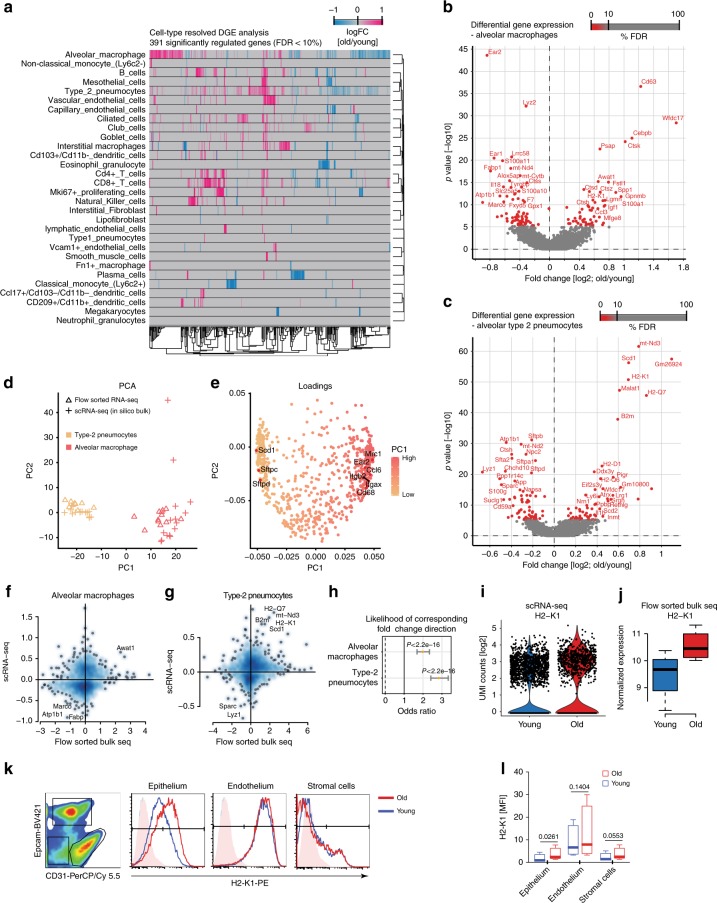
Single-cell RNA-sequencing (scRNA-seq) enables cell type-resolved differential expression analysis. a Heatmap displays fold changes derived from the cell type-resolved differential expression analysis. Rows and columns correspond to cell types and genes, respectively. Negative fold change values (blue) represent higher expression in young compared to old. Positive fold change values are colored in pink. b, c Volcano plots visualize the differential gene expression results in b alveolar macrophages and c type-2 pneumocytes. X and Y axes show average log2 fold change and −log10 p value, respectively. d Scatterplot illustrates principal component analysis (PCA) of in silico bulk samples of alveolar macrophages and type-2 pneumocytes and the projected flow-sorted bulk samples. Color and shape indicate cell-type identity and data modality. PCA loadings show that well-known marker genes define the first principal component corresponding to cell-type identity (e). Fold changes derived from the flow-sorted bulk samples and the cell type-resolved differential expression analysis are depicted on the X and Y axes respectively for alveolar macrophages (f) and type-2 pneumocytes (g). The likelihood of corresponding fold change direction was highly enriched between the scRNA-seq and flow-sorted bulk data for both cell types (h). X-axis shows the odds ratio including 95% confidence interval. Black vertical line illustrates an odd ratio of one representing equal likelihood. Increased expression of H2-K1 in old compared to young mice was observed for type-2 pneumocytes in the scRNA-seq (i) and flow-sorted bulk (j) data (n = 4 young and n = 4 old mice). For (j), the box represents the interquartile range, the horizontal line in the box is the median, and the whiskers represent 1.5 times the interquartile range. k The indicated cell lineages were gated by flow cytometry as shown in the left panel in a CD31 and Epcam co-staining and evaluated for H2-K1 expression on protein level. The histograms show fluorescence intensity distribution of the H2-K1 cell surface staining for the indicated lineages and age groups. l Boxplot shows mean fluorescence intensity for H2-K1 in the indicated cell types taken from 4 young and 4 old mice. The p values are from a two-sided t-test. The box represents the interquartile range, the horizontal line in the box is the median, and the whiskers represent 1.5 times the interquartile range

