Fig. 1.
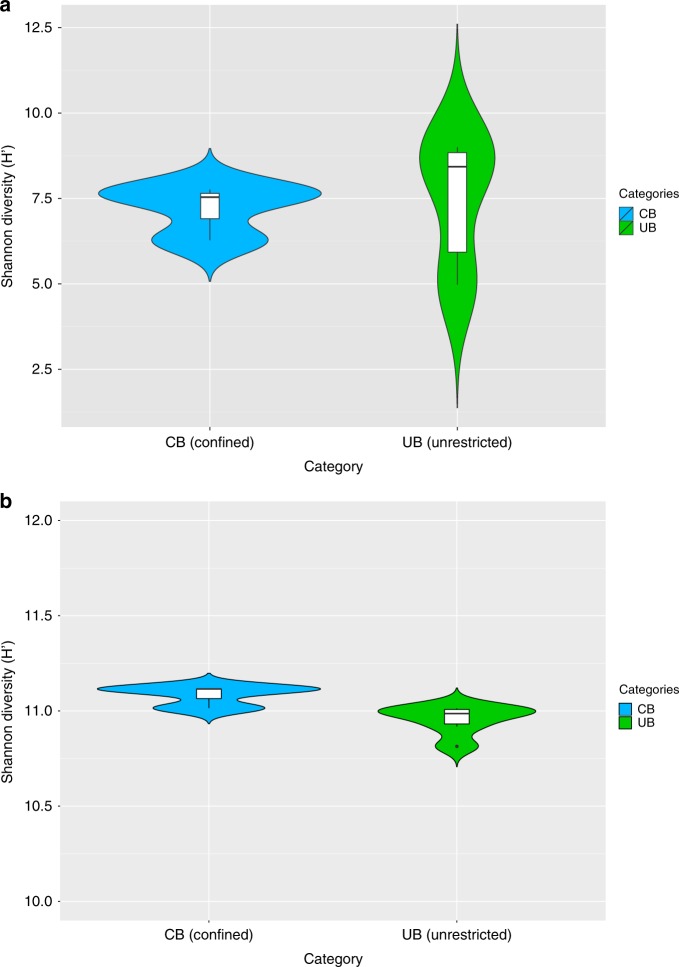
Microbial diversity estimates. Calculations were executed in MEGAN according to the results of the BLASTx searches against NCBInr. Data of single reads were filtered (unassigned reads were removed) and normalized (randomly and repeatedly subsampled to the smallest sample size). Violin plots showing the kernel probability density of the data, including a box with the median and the interquartile range, were created in R. a Significant differences of Shannon diversity estimates of microbial communities on species level in CB (confined) and UB (unrestricted built environments). b Similar Shannon diversity estimates of microbial functions on highest SEED levels (individual functional gene levels, level 5) in CB (confined) and UB (unrestricted built environments)

