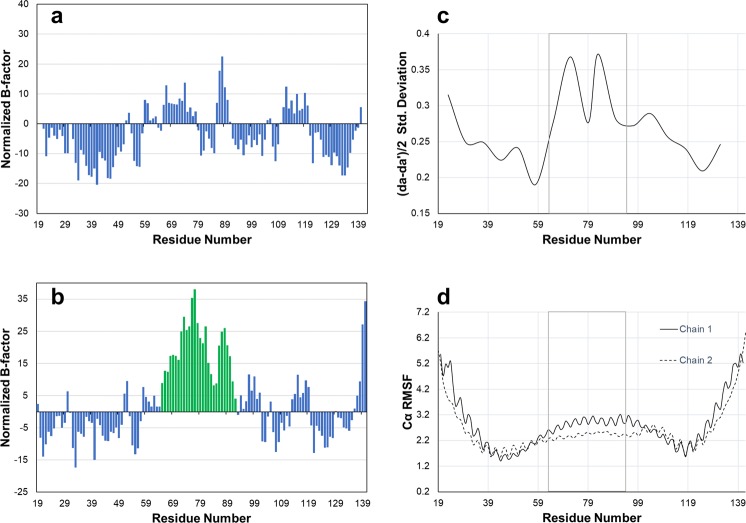
Figure 6.
Analysis of NEMO dynamics. Left panels: normalized B-factors for chains A (a) and B (b) of the structure of NEMO-EEAA. The normalized B-factors are calculated from the average B-factor over all atoms for the residue, and then averaged over a moving window of three residues. Residues 65–92 of chain B are highlighted in green bars. Right panels: Analysis of the dynamics over the last 40 ns of the MD simulation of NEMO-EEAA. The region 65–92 is boxed. (c) Standard deviation of the average interhelical distances calculated as (da + da’)/2, using residue d in the center of each heptad as the abscissa value. (d) RMSF for Cα atoms.

