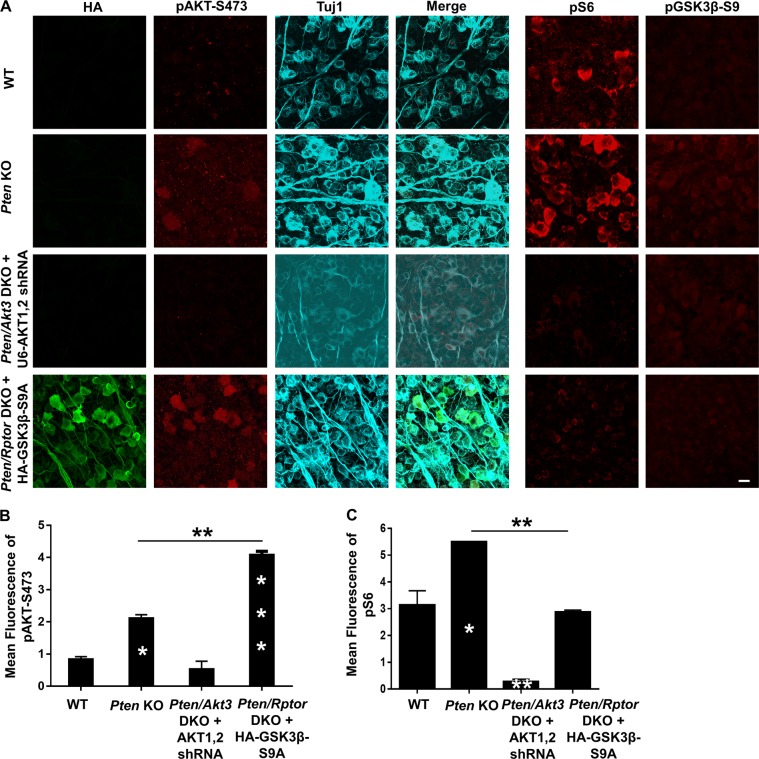
Fig. 2. Activation of AKT and its downstream effectors mTORC1 and GSK3β in RGCs by PTEN deletion and/or mTORC1 inhibition.
a Confocal images of flat-mounted retinas showing co-labeling of HA tag, Tuj1 as a marker of RGCs, pAKT-S473, and their merged images, and phosphorylation of S6 and GSK3β-S9 in a separate retina sample. Scale bar, 20 µm. b Mean fluorescence intensities of pAKT-S473 and c mean fluorescence intensities of pS6. Data are presented as means ± s.e.m, n = 3. *p < 0.05, **p < 0.01, ***p < 0.001; white stars versus WT mice. One-way ANOVA with Tukey’s multiple comparison post hoc test. ANOVA, analysis of variance; RGCs, retinal ganglion cells

