
Figure 1.
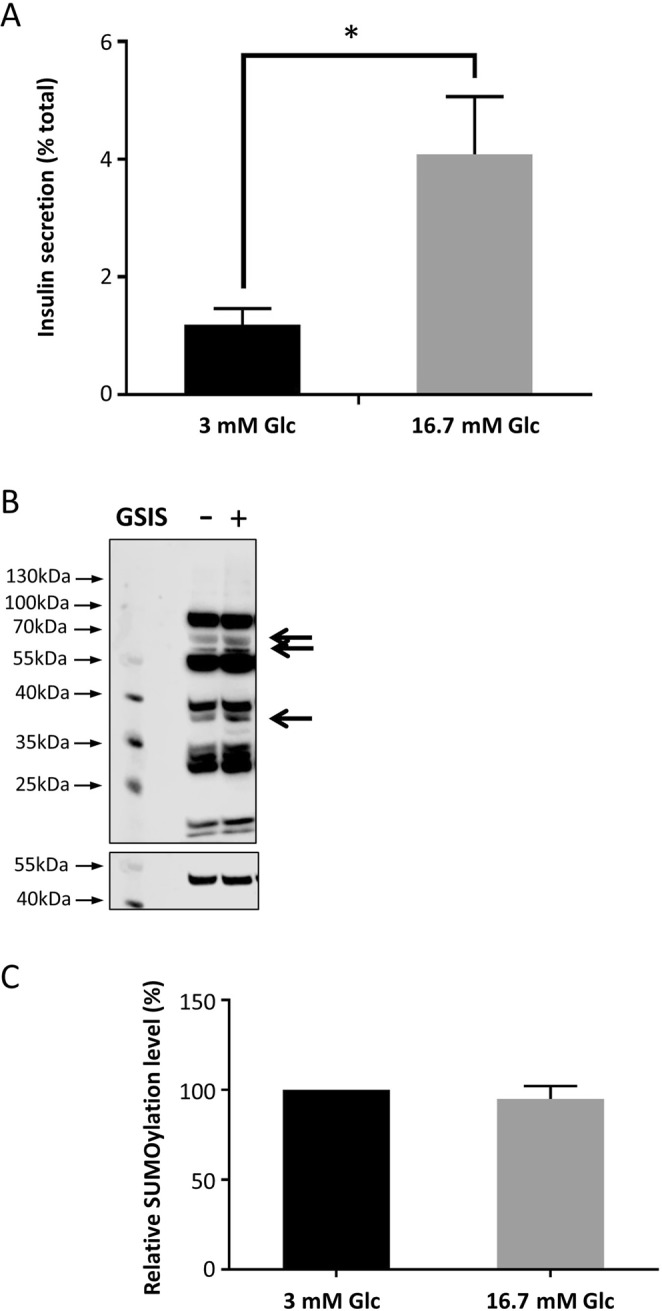
Glucose stimulation does not affect SUMOylation in INS-1E cells. (A) Comparison of % total insulin release by INS-1E cells in response to 3 mM and 16.7 mM glucose stimulation for 1 hour, as measured by insulin ELISA. *p < 0.05, Student’s t-test (n = 6). Note that subsequent insulin secretion results are presented as fold increase in secretion in the 16.7 mM glucose stimulated cells over the 3 mM glucose stimulated cells. (B) Representative Western blot for SUMO-1 (above) and alpha-tubulin (below) of whole cell lysates from cells treated with 3 mM glucose (GSIS−) or 16.7 mM glucose (GSIS+). Arrows indicate bands which potentially change on GSIS, suggesting that some substrates’ SUMOylation states are altered during GSIS. (C) Quantification of whole cells SUMOylation levels normalised to a-tubulin levels for cells treated with 3 mM and 16.7 mM glucose for 1 hour. Values are expressed as a % of 3 mM value for each replicate. Data are presented +/− SEM, n = 6.