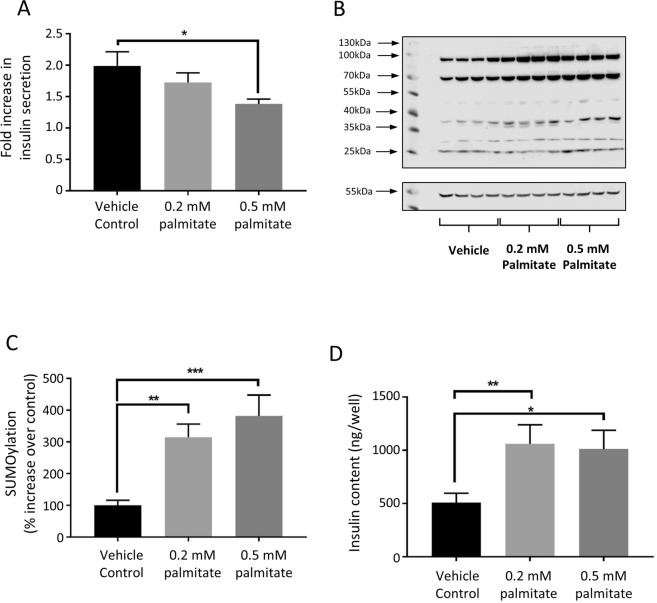
Figure 2.
Palmitate treatment enhances SUMOylation and reduces insulin secretion. (A) GSIS expressed as fold increase in stimulation comparing 16.7 mM glucose stimulation to 3 mM glucose stimulation, in INS-1E cells exposed to 0.2 mM or 0.5 mM palmitate for 96 hours. *p < 0.05 in 1-way ANOVA (n = 6). (B) Representative Western blot showing total cellular SUMOylation levels (above) and alpha-tubulin (below) of cells treated as in (A). (C) Quantification of whole cells SUMOylation levels, normalised to alpha tubulin levels, in these cells. SUMOylation is expressed as % of that seen in vehicle control. **p < 0.01, ***p < 0.001, 1-way ANOVA (n = 16). (D) Total insulin content of cells, assayed by ELISA, exposed to vehicle control, 0.2 mM and 0.5 mM palmitate. *p < 0.05, ***p < 0.01, 1-way ANOVA (n = 6). Data are presented +/− SEM.

