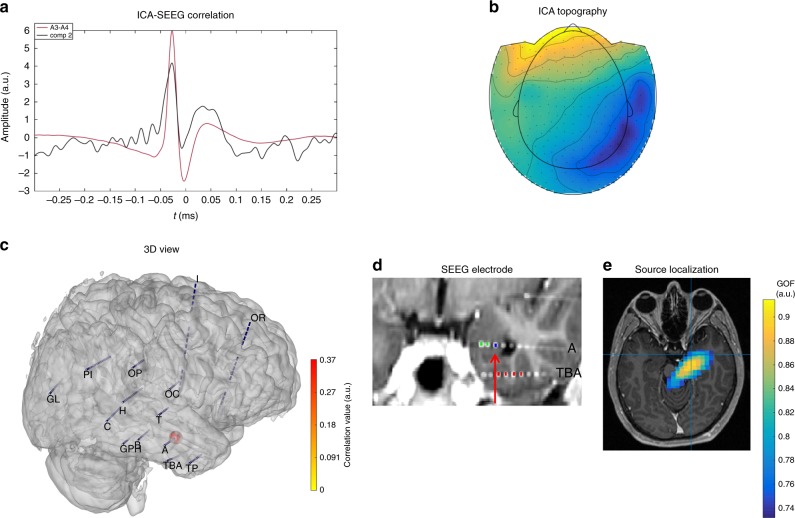
Fig. 1.
Example of purely mesial network, correlated with amygdala in P5. a SEEG/ICA correlation: in black the ICA time course and in red the time course on the SEEG contact where significant correlation was observed. b MEG topography of the ICA component. c 3D representation of MEG-SEEG correlation. Color (from yellow to red, refer to color bar) and sphere dimension correspond to the correlation value. d MRI (3D T1) with reconstruction of SEEG electrodes (showing electrodes A and TBA on the right hemisphere): the arrow indicates the contact (the most mesial within the bipolar derivation) with the highest correlation value. This contact, within electrode A, is located in the right amygdala. e Source localization (single dipole) of the ICA component overlaid on patient MRI, showing a confidence interval that includes regions sampled by the mesial contacts of electrode A

