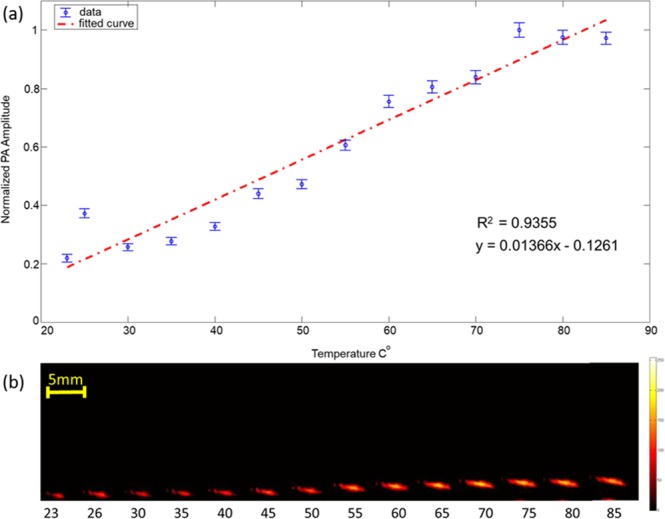
Figure 7.

(a) PA imaging to monitor the changes in amplitude of the PA signal with increase in the surrounding temperature. (a) Plot indicating normalized amplitude of the PA signal obtained versus surrounding temperature, blue dots indicate measurements and the red dashed line represents the linear fit. (b) PA images of the fiber tip at different surrounding temperature. The increase in PA amplitude as well as the effect of speed of sound variation can be clearly seen in (b).
