Figure 3.
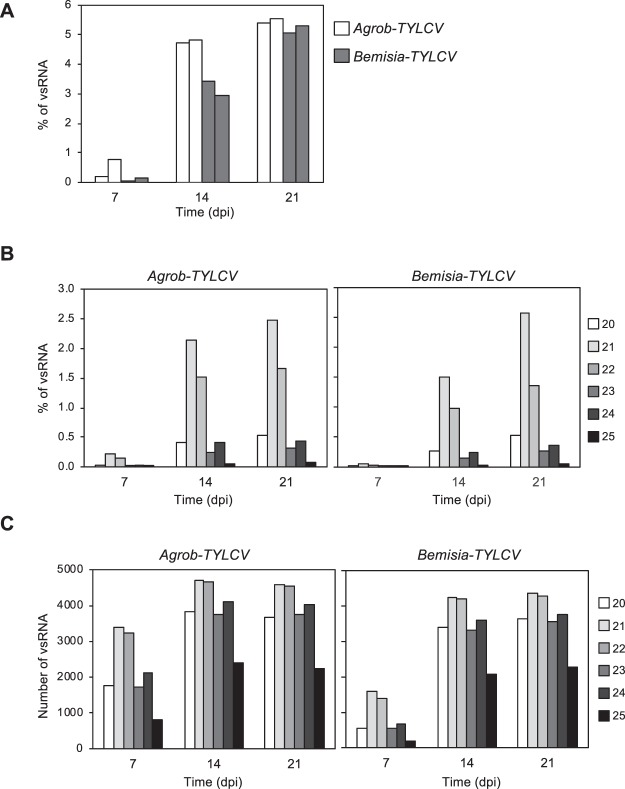
Accumulation and size distribution from TYLCV vsRNAs. Tomato plants were infected by either agroinoculation (Agrob-TYLCV) or by B. tabaci (Bemisia-TYLCV). Data from different time points during the systemic infection are shown (7, 14 and 21 dpi). (A) Percentage of vsRNA in the pool of 20–25 nt reads mapped to TYLCV genome relative to the total sRNA reads (19–35 nt). Each bar corresponds to an independent biological replicate. (B) Percentage of each size-class of 20–25 nt TYLCV vsRNA reads (redundant) relative to the total sRNA reads (19–35 nt). The bar from each vsRNA size, corresponds to the mean of the two independent biological replicates. (C) Total number of each size-class in the pool of 20–25 nt unique TYLCV vsRNA reads. The bar from each vsRNA size, corresponds to the mean of the two independent biological replicates.

