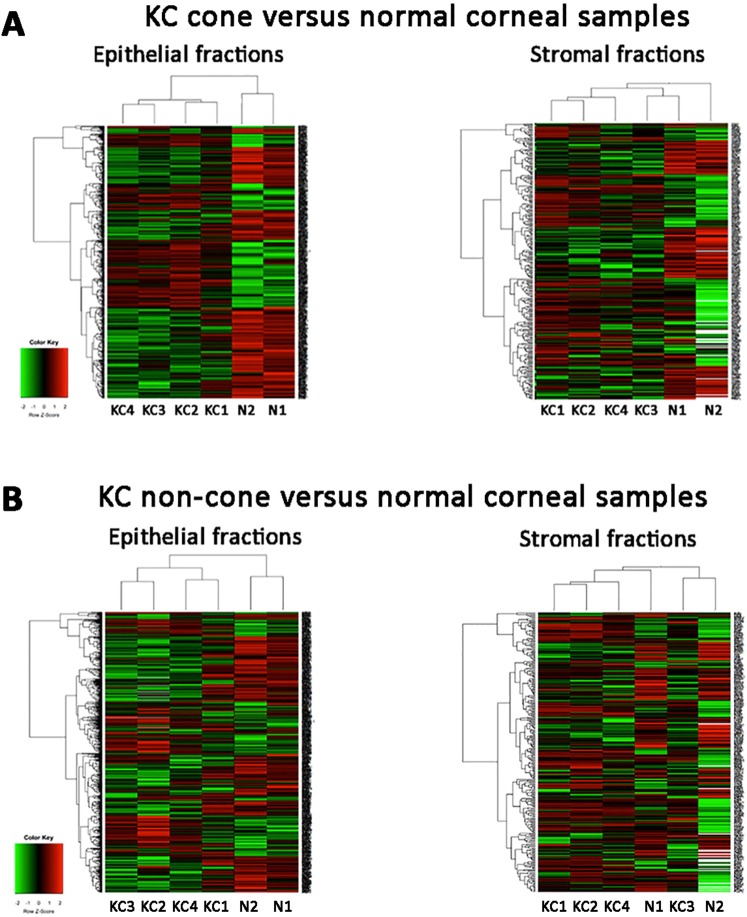
Figure 4.
Heat maps of an unsupervised hierarchical clustering of proteins with fold changes (>2 and <0.5). The colors in the map displayed the relative expression values. Green indicated the lowest expression, black for the intermediate expression, and red for the highest expression. The numerical values gave the actual values on a log2 scale, which were associated with each color. The color scale bar is shown at the lower left corner. (A) KC cone epithelium and stroma were compared to normal corneal samples. (B) KC non-cone epithelium and stroma were compared to normal corneal samples.

