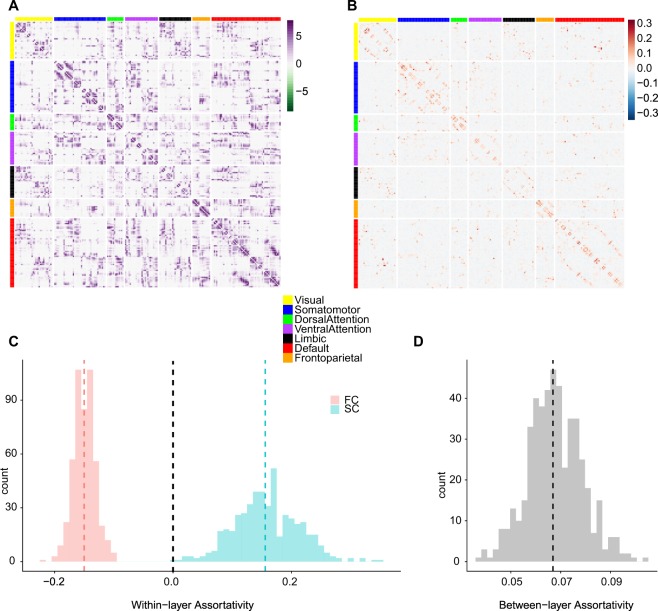
Figure 2.
(A) Averaged SC across all subjects, with edges representing log transformed streamline counts. (B) Averaged FC across all subjects with edges representing regularized partial correlation coefficients. Nodes in both panels (A) and (B) are sorted by membership in 7 canonical resting-state networks and (A,B) are only shown for representative examples of SC and FC. For analyses, individual SC and FC were estimated and used in the study. (C) Within-layer assortativity: histograms (tallying numbers of individual subjects) of the strength assortativity within the functional network (FC) and the structural network (SC), respectively. Red: FC, Blue: SC. (D) Between-layer assortativity between FC and SC.

