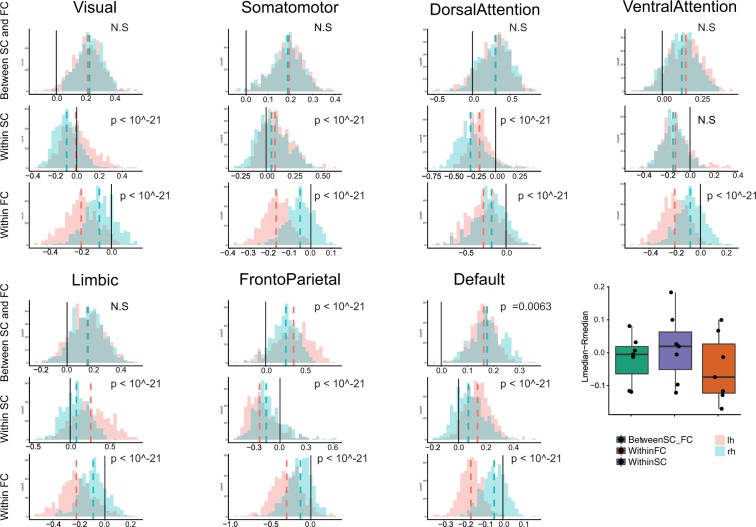
Figure 6.
(First row) Between-layer assortativity between SC and FC, (Second row) Within-layer assortativity in SC, (Third row) Within-layer assortativity in FC (Box plots, Dashed lines indicate the medians of two distributions, Black solid line is added to identify zero on the horizontal axis. A summary box plot for the median differences between the left and the right hemispheres. X-axis: Green: between-layer assortativity, Purple: within-FC assortativity, Orange: within-SC assortativity, y-axis: the difference between the median of the left hemisphere distribution of assortativity and the median of the right hemisphere distribution of assortativity in each subnetwork.

