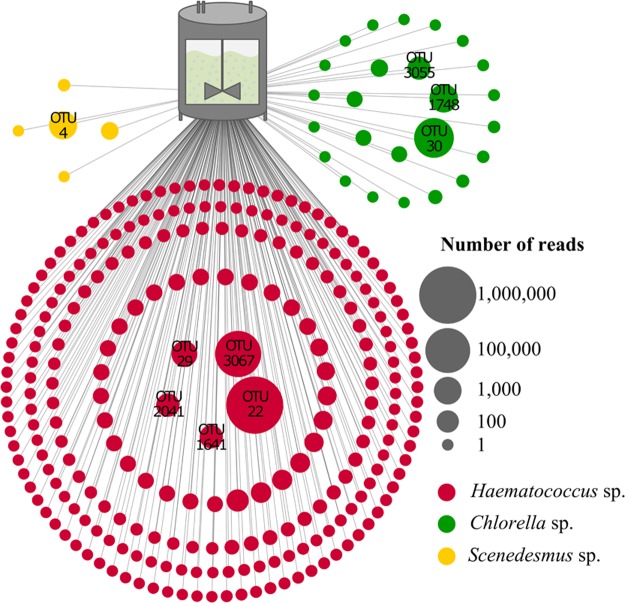
Figure 2.
Schematic visualization of the predominant microalgae subpopulation in an industrial cultivation process. The pictured OTUs were assigned to Chlorella (green), Haematococcus (red) and Scenedesmus (yellow). Node sizes correspond to the number of reads that was assigned to each OTU. All OTUs with more than 100 reads were labeled and subjected to manual BLAST searches against NCBInt. Taxonomic assignments at species level are included in Table S1.

