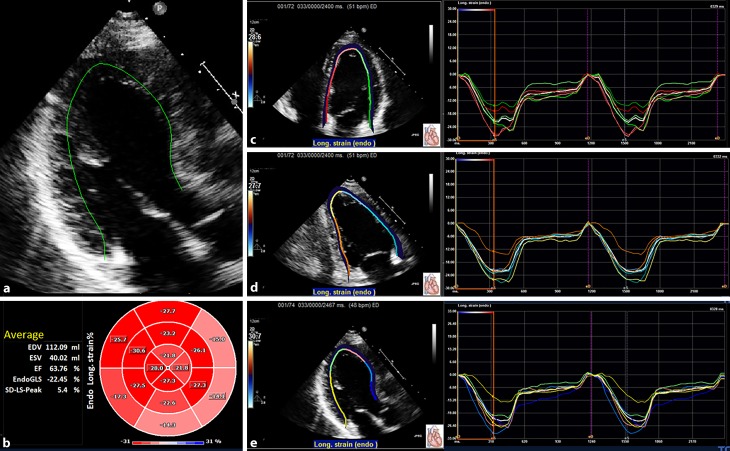
Fig. 1.
Example of left ventricular longitudinal strain measurements in a mutation carrier. The software automatically divides the left ventricular wall into 18 segments. a Tracing in the three-chamber view. b The bull’s eye in which the segmental values are plotted. On the left of the bull’s eye, the end-diastolic volume (EDV), end-systolic volume (ESV), left ventricular ejection fraction (EF), and global longitudinal strain (Endo GLS) values are presented. c The segmental strain curves in the four-chamber view. d The segmental strain curves in the two-chamber view. e The segmental strain curves in the three-chamber view

