Figure 2.
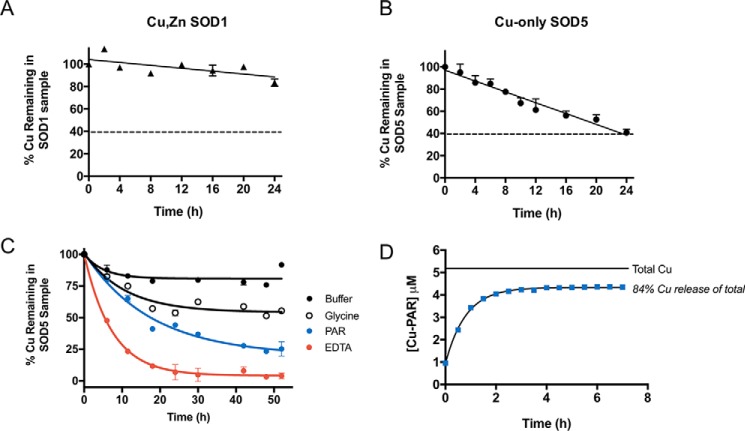
Analysis of copper binding to copper-only SOD5. A–C, Cu,Zn-SOD1 (A) or copper-only SOD5 (B and C) were subjected to dialysis against the designated chelators at pH 8.0. Following the indicated time points, copper levels in the SOD-containing samples were measured by AAS and plotted as a percentage of total copper associated with the SOD prior to dialysis. A and B, dialysis against 1 mm EDTA in a Tris buffer was carried out at 4 °C using a system in which the dialysate can capture a maximum of 60% of the total copper subject to dialysis, represented by a dotted line (see “Experimental procedures”). C, dialysis against KPO4 buffer alone or buffer containing 1 mm glycine, 0.25 mm PAR, or 1 mm EDTA at 25 °C using a system in which the dialysate can capture a maximum of 97% of the total copper subject to dialysis (see “Experimental procedures”). Results represent averages of duplicate copper measurements and are representative of two experimental trials. Measurements obtained with glycine and PAR were used to estimate KD values for SOD5 binding to copper as defined in Table 1 and described under “Experimental procedures.” D, copper-only SOD5 was incubated with PAR for the indicated times as described under “Experimental procedures,” and PAR binding to copper was determined by absorbance at 500 nm. Total copper, the amount of copper associated with SOD5 prior to dialysis. 84% of this copper reacts with PAR at equilibrium as indicated. Values represent averages of triplicate samples and are representative of three independent experiments. KD estimations were calculated as described under “Experimental procedures” and defined in Table 1.

