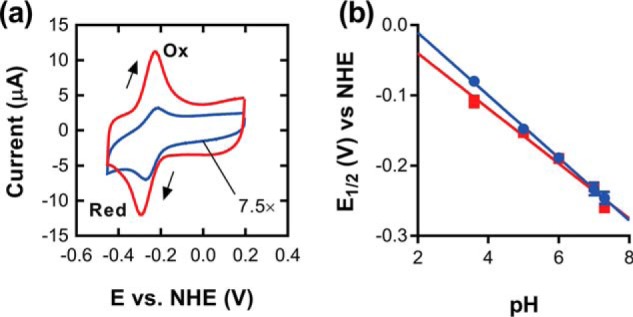
Figure 5.

Electrochemical properties of Fsq. a, cyclic voltammograms of Fsq (blue) and FAD (red) adsorbed onto modified glassy carbon electrodes. Scans were conducted at 50 mV/s in the direction indicated by the arrows in 100 mm sodium phosphate, pH 7.3. Oxidative and reductive peaks are labeled. The cyclic voltammogram of Fsq is scaled by a factor of 7.5 for comparison. b, effect of pH on the redox potential of Fsq and FAD. Over the range tested Fsq and FAD varied by −45 mV/pH unit and −39 mV/pH unit, respectively. NHE, normal hydrogen electrode; E, electrochemical potential.
