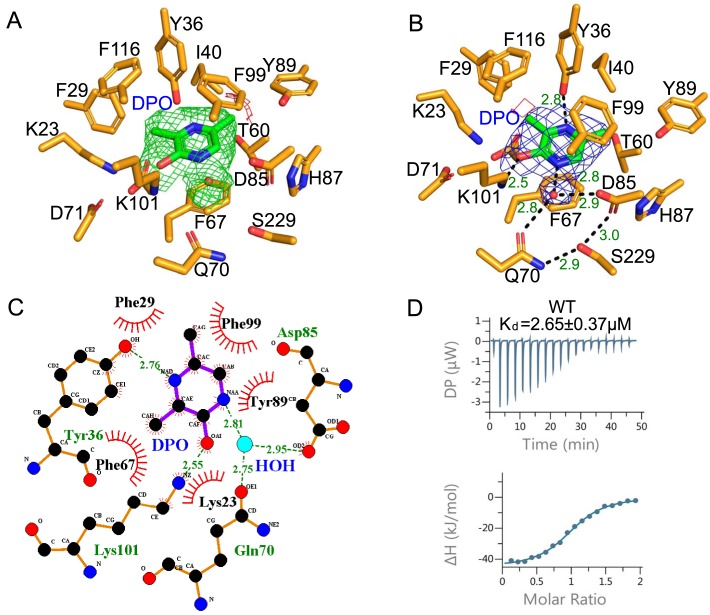
Figure 5.
DPO recognition by VqmA. A, the omit difference map of VqmA without DPO with σ level 3.0 colored green and σ level −3.0 colored red. The DPO added later is shown in green. B, the VqmA–DPO interaction observed in the PAS domain. VqmA is shown as orange sticks. The DPO molecule bound to VqmA is depicted as green sticks. A water molecule is shown as a red sphere. DPO and a water molecule were merged with the electron density (2Fo − Fc map contoured with σ level 1.0 colored with blue, Fo − Fc map contoured with σ level 3.0 colored with red and green). C, two-dimensional diagram of the interactions of VqmA with the DPO. D, the ITC profile for the interaction of WT VqmA with DPO. The ITC profiles of VqmA's mutants are shown in Fig. S2.

