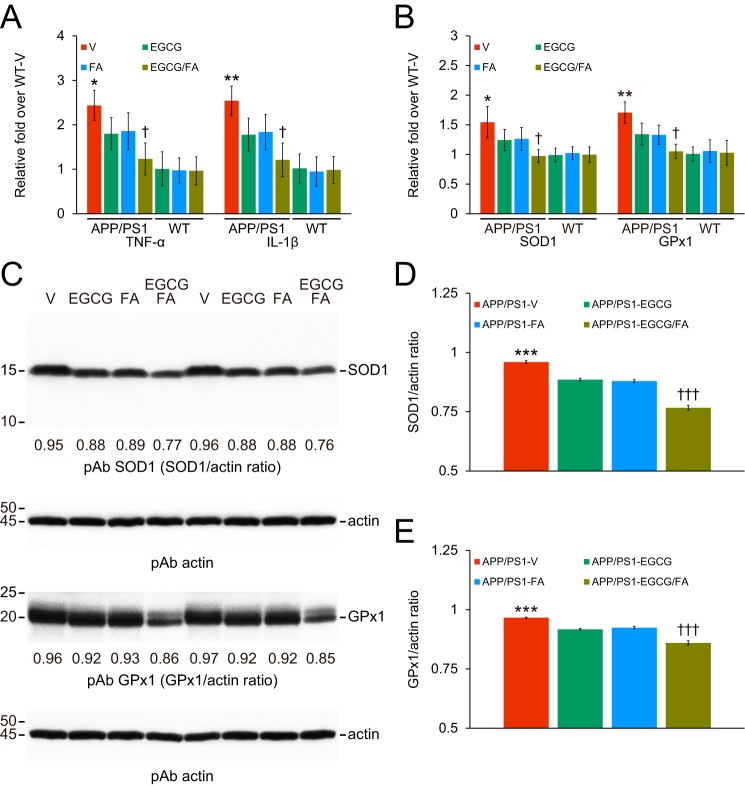
Figure 9.
Combination therapy with EGCG plus FA dampens neuroinflammation and oxidative stress. Data were obtained from APP/PS1 mice that received vehicle (APP/PS1-V, n = 8), EGCG (APP/PS1-EGCG, n = 8), FA (APP/PS1-FA, n = 8), or EGCG plus FA (APP/PS1-EGCG/FA, n = 8) for 3 months commencing at 12 months of age (mouse age at sacrifice = 15 months). Data for A and B additionally included WT mice treated in parallel with vehicle (WT-V, n = 8), EGCG (WT-EGCG, n = 8), FA (WT-FA, n = 8), or EGCG plus FA (WT-EGCG/FA, n = 8). Data for A and B as well as D and E are presented as standard deviations of the means. QPCRs are shown for tumor necrosis factor-α (TNF-α) or interleukin-1β (IL-1β) proinflammatory cytokines or for key oxidative stress markers superoxide dismutase 1 (SOD1) or GSH peroxidase 1 (GPx1). Data for A and B are expressed as relative fold over WT-V mice. C, Western blots are shown using anti-Cu/Zn SOD polyclonal antibody (pAb SOD1) or by anti-GPx1 polyclonal antibody (pAb GPx1). Western blots included each mouse (n = 8 per group), and quantitative data were averaged. Ten μg of protein from each sample was equally loaded per lane. Actin is included as a loading control for each appropriate blot, and densitometry data are shown below each lane. Densitometry data are shown for ratios of SOD1 to actin (D) or for GPx1 to actin (E). Statistical comparisons for A and B are between-groups but within each mRNA species. Statistical comparisons for D and E are within each protein but between-groups. *, p < 0.05; **, p < 0.01; ***, p < 0.001 for APP/PS1-V versus the other treated mice; †, p < 0.05; †††, p < 0.001 for APP/PS1-EGCG/FA versus APP/PS1-EGCG or APP/PS1-FA mice. V, vehicle.

