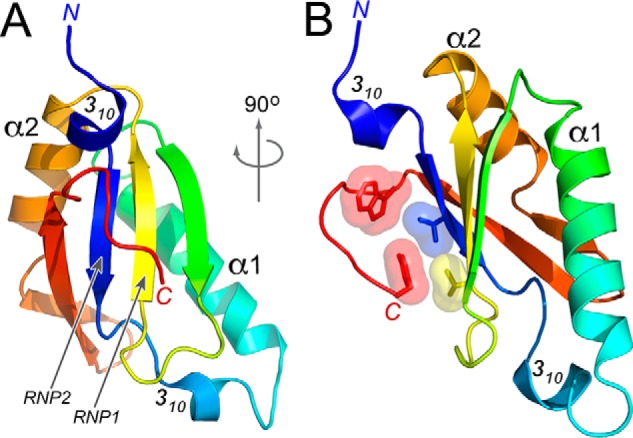
Figure 2.

Structure of the Tat-SF1 UHM at 1.13 Å resolution. A, view into the β-sheet. Arrows indicate the β-strands corresponding to RNP1 and RNP2 of the RRM-like fold. B, view rotated 90° about the y axis. Interactions between the C-terminal Tat-SF1 UHM extension and degenerate RNP residues are shown in surface and stick representation. The UHM is colored in a rainbow gradient from blue to red at the N and C termini.
