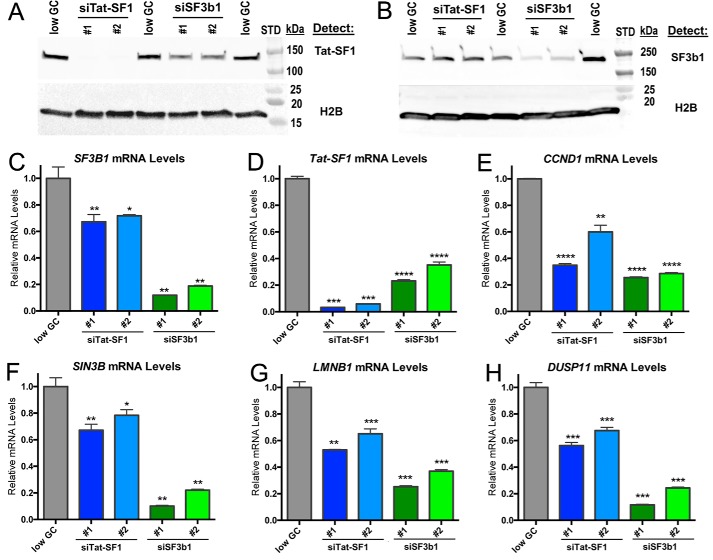
Figure 8.
Tat-SF1 expression levels decline following SF3b1 depletion and in turn decrease expression of similar representative transcripts as SF3b1. A and B, immunoblots demonstrating Tat-SF1 or SF3b1 knockdown following transfection of HEK293T cells with the indicated StealthTM siRNAs or a low G/C control siRNA (“low GC”). Whole cell lysates were analyzed by SDS-PAGE and immunoblotted for either: A, Tat-SF1 or B, SF3b1. H2B is encoded by an intronless gene and hence an appropriate loading control. C–H, relative levels of TAT-SF1, SF3B1, or the indicated transcripts were determined by RT-qPCR of total RNA isolated from HEK 293T cells following transfection with the indicated siRNAs. Amplification of the LMNB1 exon 5/6 junction is shown. The LMNB1 exon 7/8 junction gave similar results as shown in Fig. S1. Primer locations and sequences are given in Table S1. Unpaired, two-tailed t tests with Welch's correction: *, p < 0.05; **, p < 0.005; ***, p < 0.0005; ****, p < 0.0001.

