Figure 1.
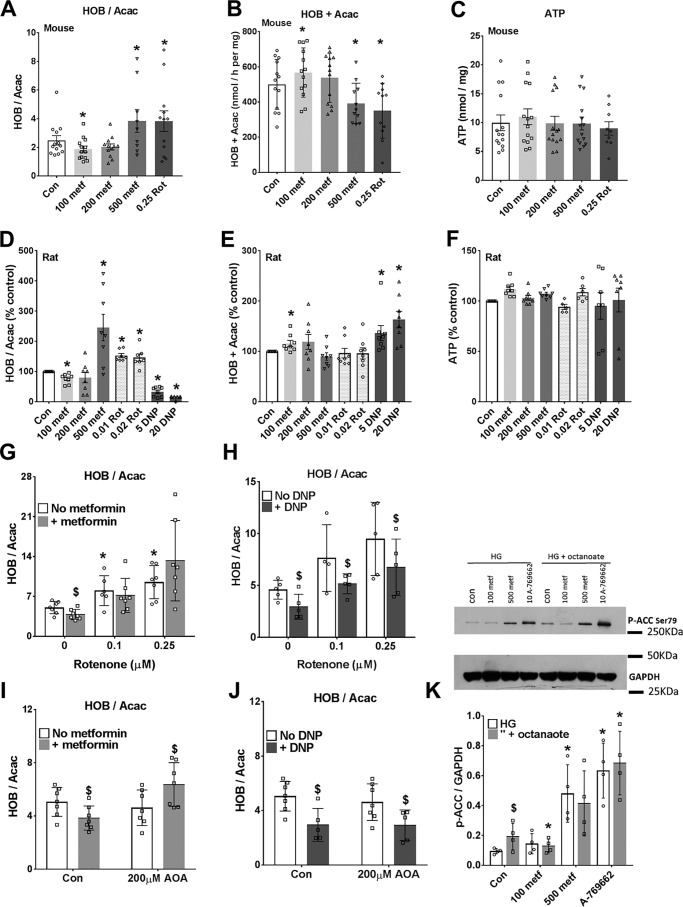
Biphasic effect of metformin on the mitochondrial redox state: more oxidized at low metformin. Mouse hepatocytes (A–C) and rat hepatocytes (D–F) were precultured for 24 h and then incubated for 2 h in MEM with the metformin concentrations (100–500 μm) indicated. The medium was then replaced with fresh MEM containing 25 mm glucose, 0.25 mm octanoate, and the additions shown, and incubations were for 1 h. The medium was collected for analysis of acetoacetate (Acac) and d-3-hydroxybutyrate (HOB), and the cells were snap-frozen for ATP analysis. A and D, ratio of 3-hydroxybutyrate/acetoacetate; B and E, total production of acetoacetate + 3-hydroxybutyrate; C and F, cell ATP. Mouse data are expressed per mg of protein, and rat data are expressed as a percentage of control. Shown are means ± S.D. (error bars) for n = 8–14 hepatocyte preparations; *, p < 0.05 relative to control. G–J, mouse hepatocytes cultured for 3 h after cell plating and then incubated for 2 h without (open) or with (shaded) 100 μm metformin (G and I) and then for 1 h in fresh MEM containing 25 mm glucose + 0.125 mm octanoate and the additions indicated. G and H, effects of metformin (100 μm) or DNP (20 μm) with/without rotenone (0.1 or 0.25 μm); I and J, with/without AOA (200 μm). Results are means ± S.D.; n = 5–7. *, p < 0.05 relative to respective control; $, metformin or DNP effect. K, immunoblot for phospho-ACC for mouse hepatocytes incubated with/without metformin (100 or 500 μm) and A-769662 (10 μm) for 3 h in MEM with 25 mm glucose (HG) with/without 0.125 mm octanoate for the last hour. Shown are representative immunoblotting and densitometry for n = 4 mouse hepatocyte preparations. *, p < 0.05 relative to respective control; $, p < 0.05 octanoate effect.

