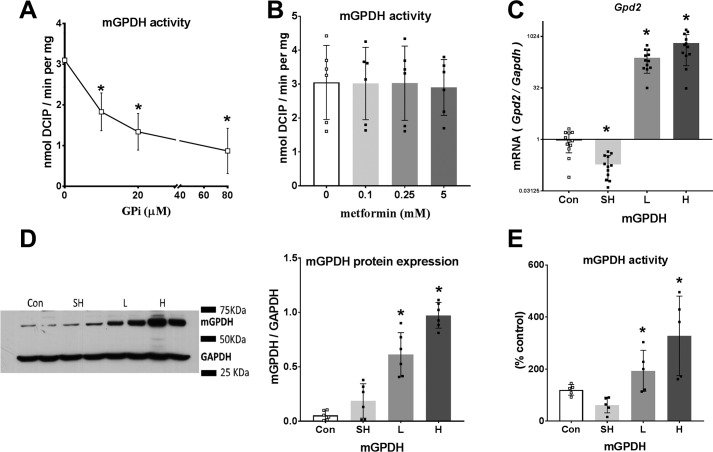
Figure 4.
Endogenous mGPDH activity and effects of GPi and metformin. A and B, activity of endogenous mGPDH assayed in permeabilized hepatocytes with the concentrations of GPi (A) or metformin (B) indicated. C–E, hepatocytes were either untreated (Con) or treated with 8 × 10⁸ pfu/ml Adv-SH-mGpd2 (SH) for Gpd2 knockdown or with Adv-mGpd2 at 1.6 (L) or 4.8 (H) × 107 pfu/ml for mGPDH overexpression. C, Gpd2/Gapdh mRNA expressed relative to untreated control. D, immunoactivity of mGPDH/GAPDH. E, mGPDH enzyme activity. Results are means ± S.D. (error bars) for n = 6–12 (A and B) or 5–6 (C–E) experiments. *, p < 0.05 relative to control.

