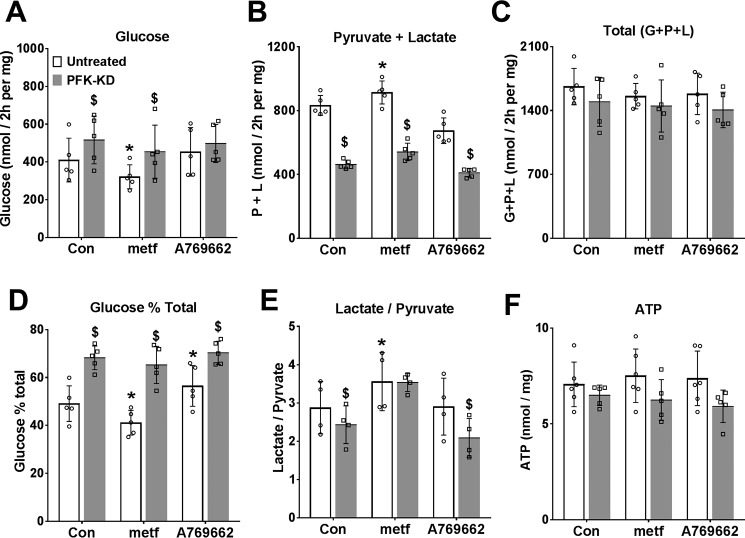
Figure 9.
Comparison of metformin and an AMPK activator on DHA metabolism in cells depleted of fructose 2,6-P2. Mouse hepatocytes were either untreated (open bars) or treated (filled bars) with an adenoviral vector for expression of PFK-KD to deplete cell fructose 2,6-P2 (38). After a 20-h culture, they were preincubated for 2 h in glucose-free medium with 100 μm metformin or 10 μm A-769662. They were then incubated for 2 h in fresh medium containing 5 mm DHA. A, glucose production; B, pyruvate + lactate production; C, total production of glucose + pyruvate + lactate (C3 units); D, glucose percentage of total metabolism; E, lactate/pyruvate ratio; F, cell ATP. Results are means ± S.D. (error bars) for n = 4–6; *, p < 0.05, relative to respective control; $, effect of PFK-KD.

