Figure 3.
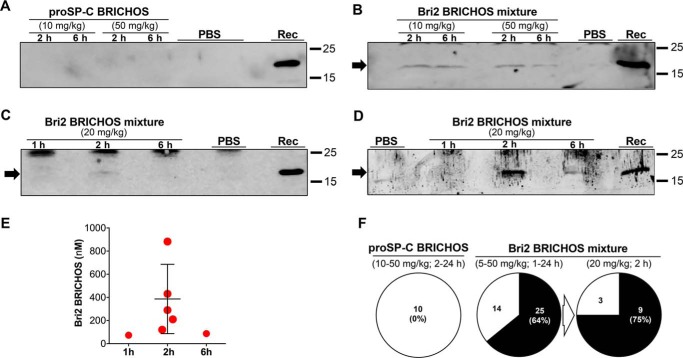
Rh Bri2, but not proSP-C BRICHOS, is detected in the mouse brain after intravenous injection. A–D, Western blot analysis of brain homogenates collected 1, 2, or 6 h after injection of rh proSP-C BRICHOS using an anti-S tag (A) or rh Bri2 BRICHOS using an anti-Bri2 BRICHOS antibody (B) and an anti-AU1 tag antibody (C and D) and PBS-injected controls. Rh Bri2 BRICHOS-AU1 (D) from the same sample as in C was immunoprecipitated. Lanes marked Rec indicate the migration of purified rh proSP-C or Bri2 BRICHOS-AU1. E, sandwich ELISA quantification of rh Bri2 BRICHOS-AU1 in brain homogenates 1, 2, and 6 h after injection of 20 mg/kg. Each point represents data from one mouse, and the error bar shows mean value and standard deviations. F, extent of detected rh proSP-C BRICHOS, rh Bri2 BRICHOS, or rh Bri2 BRICHOS-AU1 in the brain tissue of all injected mice. The dose ranges and times between injection and sampling used are given in parentheses above each circle. For the 5–50 mg/kg injections, both rh Bri2 BRICHOS and rh Bri2 BRICHOS-AU1 were used, whereas for the 20 mg/kg injections chart, only rh Bri2 BRICHOS-AU1 was used. In the circles, the numbers in each sector refer to the total number of mice in which rh BRICHOS was detected (black sectors) or not detected (white sectors) by Western blotting, immunoprecipitation, or ELISA in brain tissue. The percentages in parentheses refer to the extent of rh BRICHOS detection in brain tissue. The entire gels for A–D are shown in Fig. S3.

