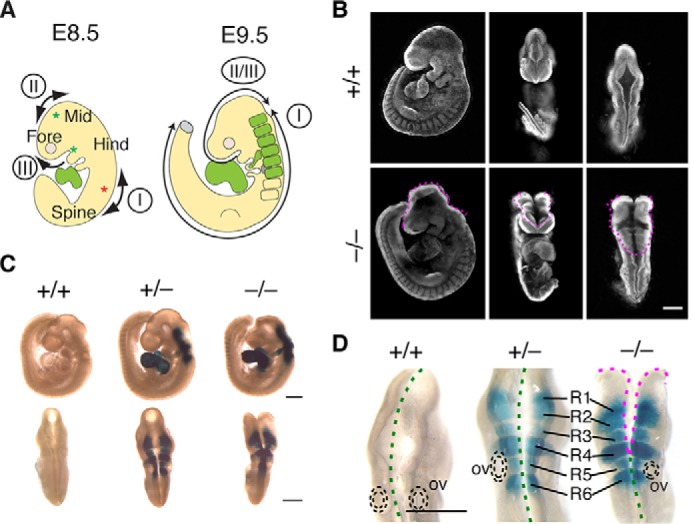
Figure 1.

Fhod3 expression in rhombomeres 1–6 within the hindbrain. A, schematic representation of the cranial neural tube closure in mouse embryos. Closure I occurs from the hindbrain/spinal boundary (red asterisk) and proceeds bidirectionally. Closures II and III begin at the forebrain/midbrain boundary and the rostral end of the neural plate, respectively (green asterisks). By E9.5, the caudally directed closure II/III meets the rostrally directed closure I to seal the midbrain-hindbrain region. For details, see the Result section. Fhod3 is expressed in the heart and rhombomeres within the hindbrain region (green) during the neural tube closure. Fore, forebrain; Mid, midbrain; Hind, hindbrain. B, whole-mount nuclear fluorescent staining of Fhod3+/+ (+/+) and Fhod3−/− (−/−) embryos at E9.5. The open regions of the cranial neural tube are indicated by magenta dotted lines. Scale bar, 500 μm. C and D, whole-mount lacZ staining of Fhod3+/+, Fhod3+/−, and Fhod3−/− embryos at E9.5. Open and closed regions are indicated by magenta and green dotted lines, respectively. R1–6, rhombomeres 1–6; ov, otic vesicle. Scale bars, 500 μm.
