Figure 3.

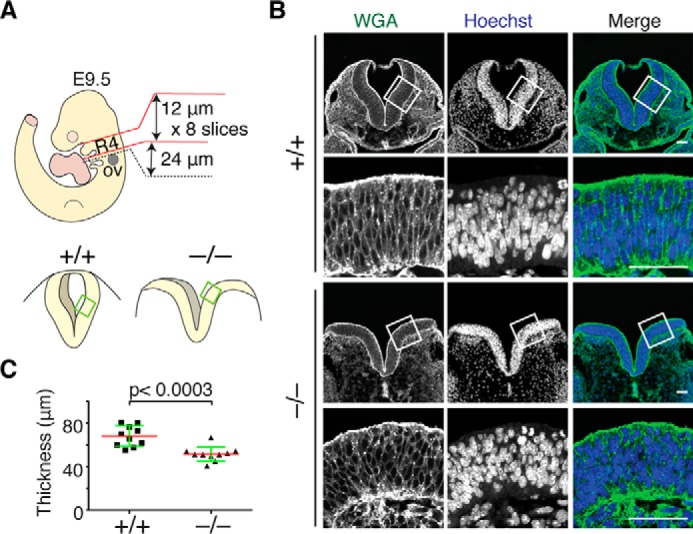
Abnormal organization of neuroepithelial cells in the lateral neural plates of Fhod3−/− embryos. A, schematic representation of the orientation of transverse sections used in B and in Figs. 4 and 5. Transverse sections at the level of rhombomere 4 were defined by their position relative to the otic vesicle (ov). B, confocal fluorescence micrographs of the hindbrain of Fhod3+/− (+/−) and Fhod3−/− (−/−) embryos at E9.5. Transverse sections at the level of rhombomere 4 were subjected to fluorescence staining for the plasma membrane with WGA (green) and for the nucleus with Hoechst (blue). Scale bars, 50 μm. C, quantification of neural plate height. The height (distance from apical to basement membrane) of lateral neural plates was measured at the cropped region of Fhod3+/+ and Fhod3−/− embryos at E9.5 (n = 10 mice/genotype). Data are shown as mean (red line) ± S.D. (green lines).
