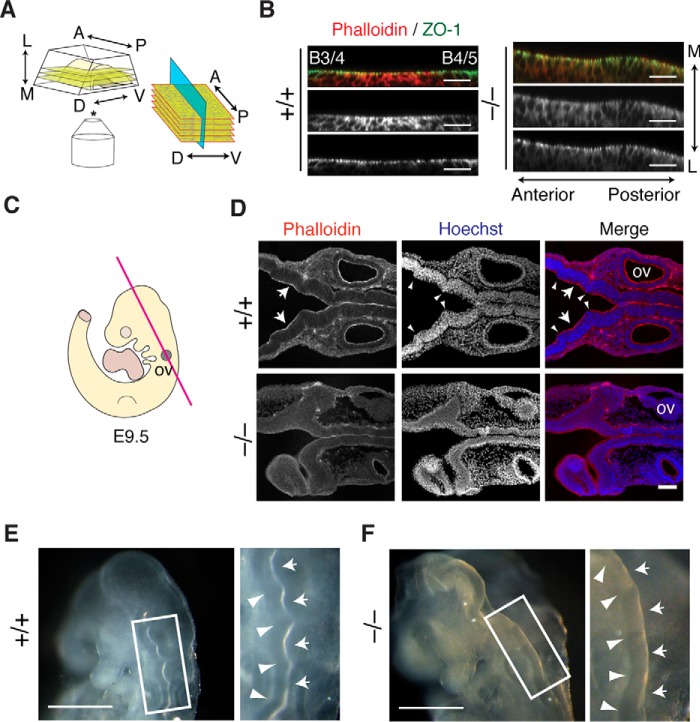
Figure 8.
Effects of Fhod3 depletion in morphological segmentation of rhombomeres. A, schematic representation of the orientation of optical sectioning of whole-mounted neural tubes embedded in an agarose gel used in B. B, orthogonal projection of Z-stack slices of whole-mounted neural tubes at rhombomere 4 in the hindbrain of Fhod3+/+ (+/+) and Fhod3−/− (−/−) embryos at E9.5. Whole-mount embryos were subjected to immunofluorescence staining for ZO-1 (green) and F-actin (red) (B, boundary). Scale bars, 100 μm. C, schematic representation of the orientation of longitudinal coronal sections used in D. D, longitudinal coronal sections of the hindbrain of Fhod3+/+ and Fhod3−/− embryos at E9.5. Sections were subjected to fluorescence staining for F-actin (red) and nucleus (blue). Inter-rhombomere boundaries are indicated by arrowheads. Scale bars, 100 μm. E and F, whole-mount images of Fhod3+/+ (E) and Fhod3−/− (F) embryos at E9.5 in lateral and dorsal views (left and right, respectively). Inter-rhombomere boundaries and rhombomere bulges are indicated by arrowheads and arrows, respectively. Scale bars, 500 μm.

