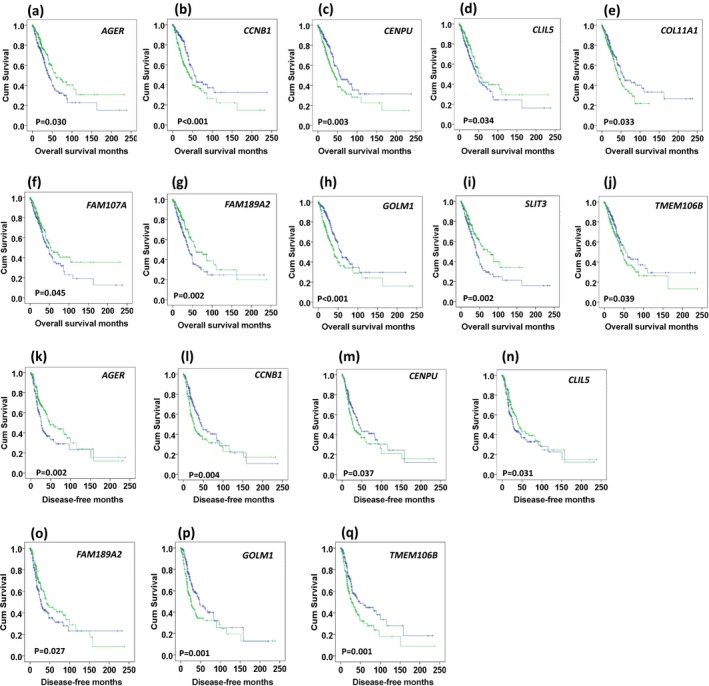
Figure 3.

Association of genes with OS or DFS, analyzed by Kaplan–Meier survival plots. (a–j) Association of ten genes (AGER, CCNB1, CENPU, CLIL5, COL11A1, FAM107A, FAM189A2, GOLM1, SLIT3, and TMEM106B) with OS. (k–q) Association of seven genes (AGER, CCNB1, CENPU, CLIL5, FAM189A2, GOLM1, and TMEM106B) with DFS. Expression levels of a gene were dichotomized into high expression (green line) and low expression (blue line) using the median as a threshold. DFS: disease‐free survival; OS: overall survival
