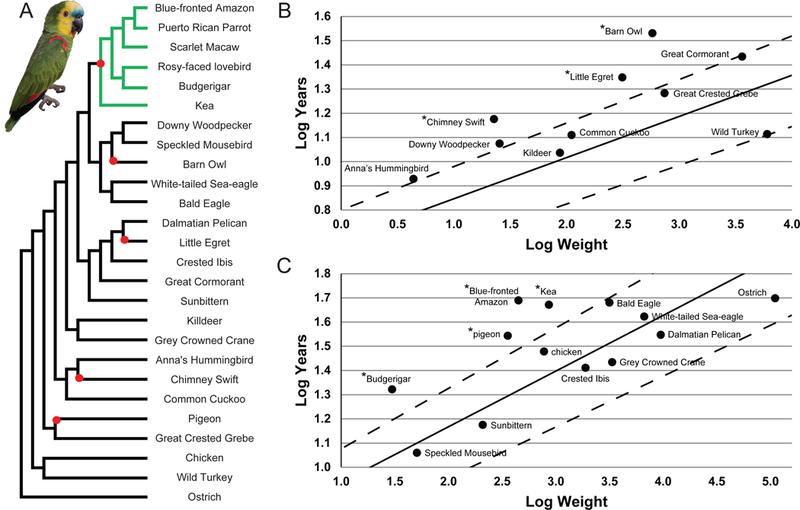
Figure 1. Phylogenetic Relationships and Longevity of Parrots, including Amazona aestiva, in Relation to Other Birds.

(A) This schematic phylogeny, derived from previously published studies [10, 11], depicts the relationship between parrots and all other birds analyzed in the longevity analyses. Red nodes indicate the occurrence of high longevity, and were used as branches to test for nonneutral sequence evolution in long-lived birds against a null model using a likelihood ratio test. The photo depicts Moises, the adult male Blue-fronted Amazon whose genome was sequenced for this study. (B - C) The expected lifespan of the 23 bird species analyzed for genomic signatures of longevity in plotted as a solid line, based on calculations derived from Prinzinger [12] that describe the relationship between mass (log weight) and longevity (log years) for wild (B) and captive (C) birds (see STAR Methods: Longevity). Species falling outside of the dashed lines deviate significantly from expected lifespan based on mass, and are indicated with a “*”. See also Table S1.
