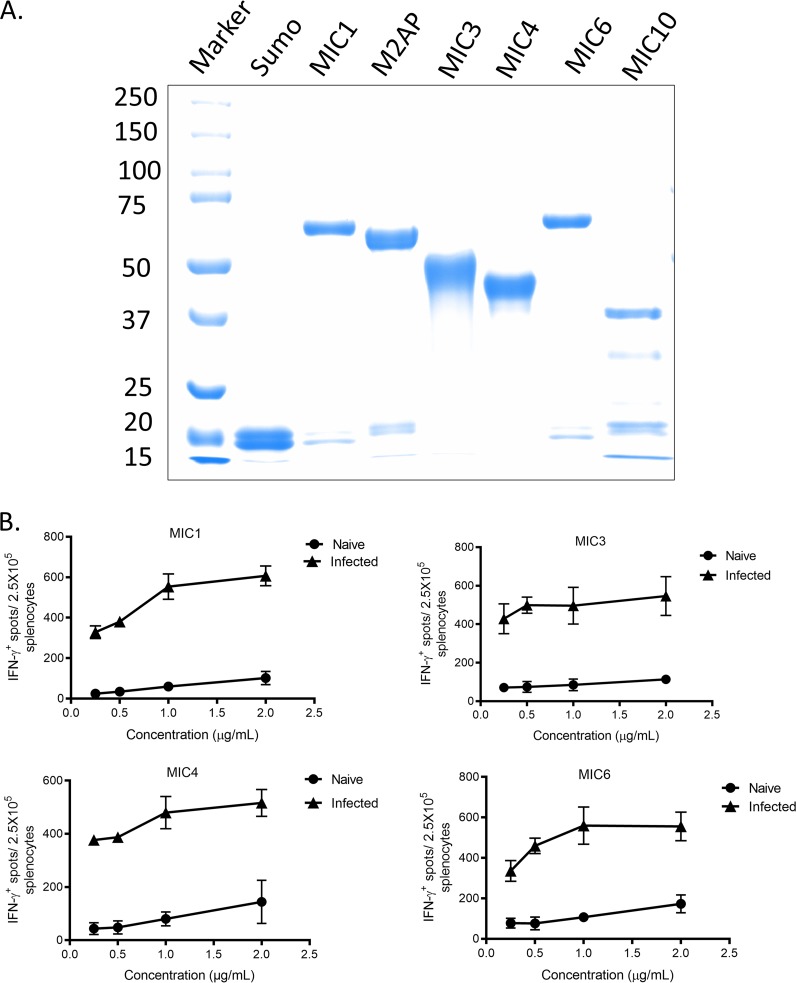
FIG 1.
Separation of purified MIC fusion proteins by SDS-PAGE. (A) Coomassie blue-stained gel of recombinant proteins. Sumo was used as a control for the fusion proteins. The smaller bands in the recombinant protein lanes likely represent Sumo (12.5 kDa) as a breakdown product. Values on the left are molecular masses, in kilodaltons. (B) Dose-response curves to identify optimal concentration of MIC proteins for ELISPOT assay. Splenocytes from C57BL/6 mice that were naive (n = 3) or chronically infected with T. gondii (n = 3) were stimulated with different concentrations of MIC proteins for 24 h. For each protein, concentrations that resulted in the maximum positive response in infected mice with minimal responses in naive mice were selected. Data are presented as mean of IFN-γ+ spots/2.5 × 106 cells ± SD from three mice in one experiment.

