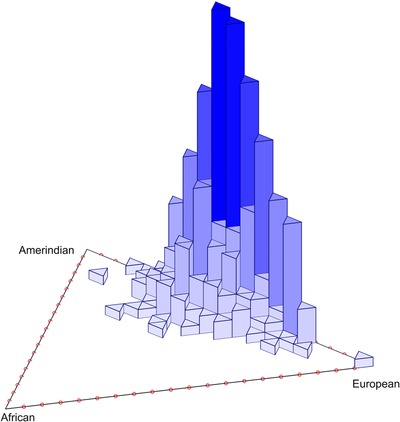
Figure 1.

Histogram of estimated ancestry proportion from three parental populations. European, African, and Amerindian using Admixture 1.23. The peak number of individuals (vertical axis) is concentrated between European and Amerindian ancestry, with little contribution from Africa [Color figure can be viewed at wileyonlinelibrary.com]
