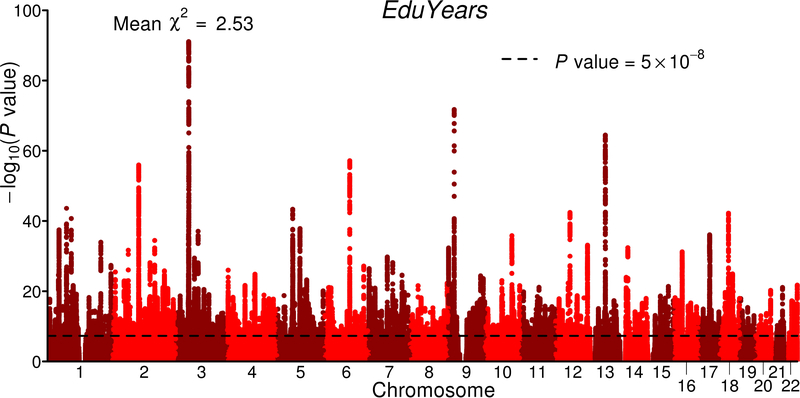
Fig. 1. Manhattan Plot for GWAS of EduYears (N = 1,131,881).
P values and the mean χ2 shown in figure are based on inflation-adjusted test statistics. The x-axis is chromosomal position, and the y-axis is the significance on a −log10 scale. The dashed line marks the threshold for genome-wide significance (P = 5×10⁻⁸).

