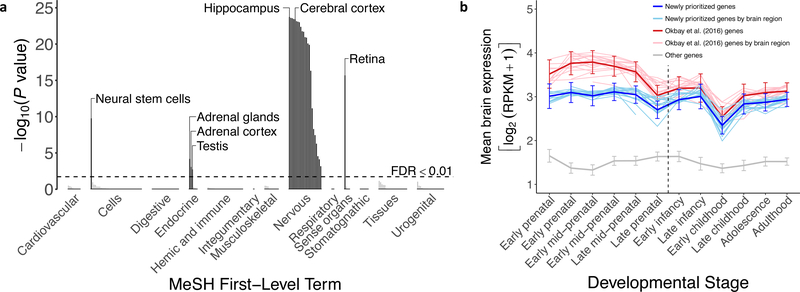
Fig. 3. Tissue-specific expression of genes in DEPICT-defined loci.
(a) We took microarray measurements from the Gene Expression Omnibus19 and determined whether the genes overlapping EduYears-associated loci (as defined by DEPICT) are significantly overexpressed (relative to genes in random sets of loci) in each of 180 tissues/cell types. These types are grouped in the figure by Medical Subject Headings (MeSH) first-level term. The y-axis is the one-sided P value from DEPICT on a –log10 scale. The 28 dark bars correspond to tissues/cell types in which the genes are significantly overexpressed (FDR < 0.01), including all 22 classified as part of the central nervous system (see Supplementary Table 6 for identifiers of all tissues/cell types). (b) Whereas genes prioritized by DEPICT in a previous analysis based on a smaller sample10 tend to be more strongly expressed in the brain prenatally (red curve), the 1,703 newly prioritized genes show a flat trajectory of expression across development (blue curve). Both groups of DEPICT-prioritized genes show elevated levels of expression relative to protein-coding genes that are not prioritized (gray curve). Analyses were based on RNA-seq data from the BrainSpan Developmental Transcriptome34. These results are based on the full GWAS sample of 1,131,881 individuals. Error bars represents 95% confidence intervals.

