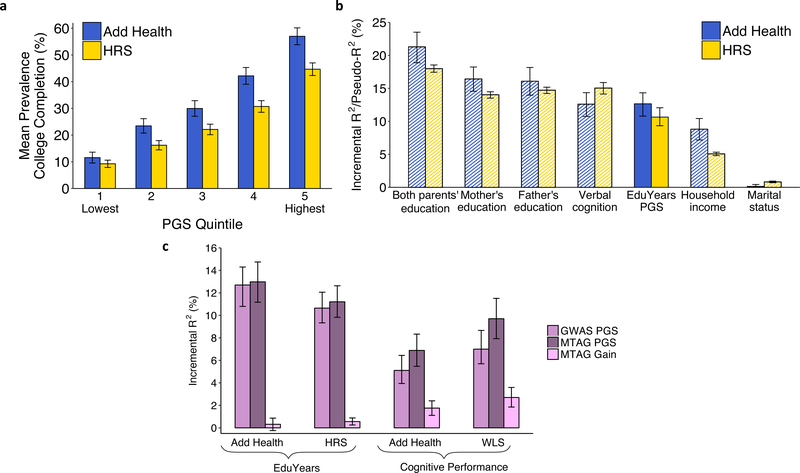
Fig. 4. Prediction Accuracy.
(a) Mean prevalence of college completion by EduYears PGS quintile. Error bars show the 95% confidence interval for the mean. (b) Incremental R2 of the EduYears PGS compared to that of other variables. (c) Incremental R2 of the PGS for EduYears and Cognitive Performance constructed from the respective GWAS or MTAG summary statistics. Error bars for the R2 values show bootstrapped 95% confidence intervals with 1000 iterations each. Sample sizes are N = 4,775 for Add Health and N = 8,609 for HRS.

